

Question: someone pls solve this assignment fo me asap 1. Here is the New Brunswick Minimum Wage data from 1970-2019 in black dots, and the Canadian
someone pls solve this assignment fo me asap
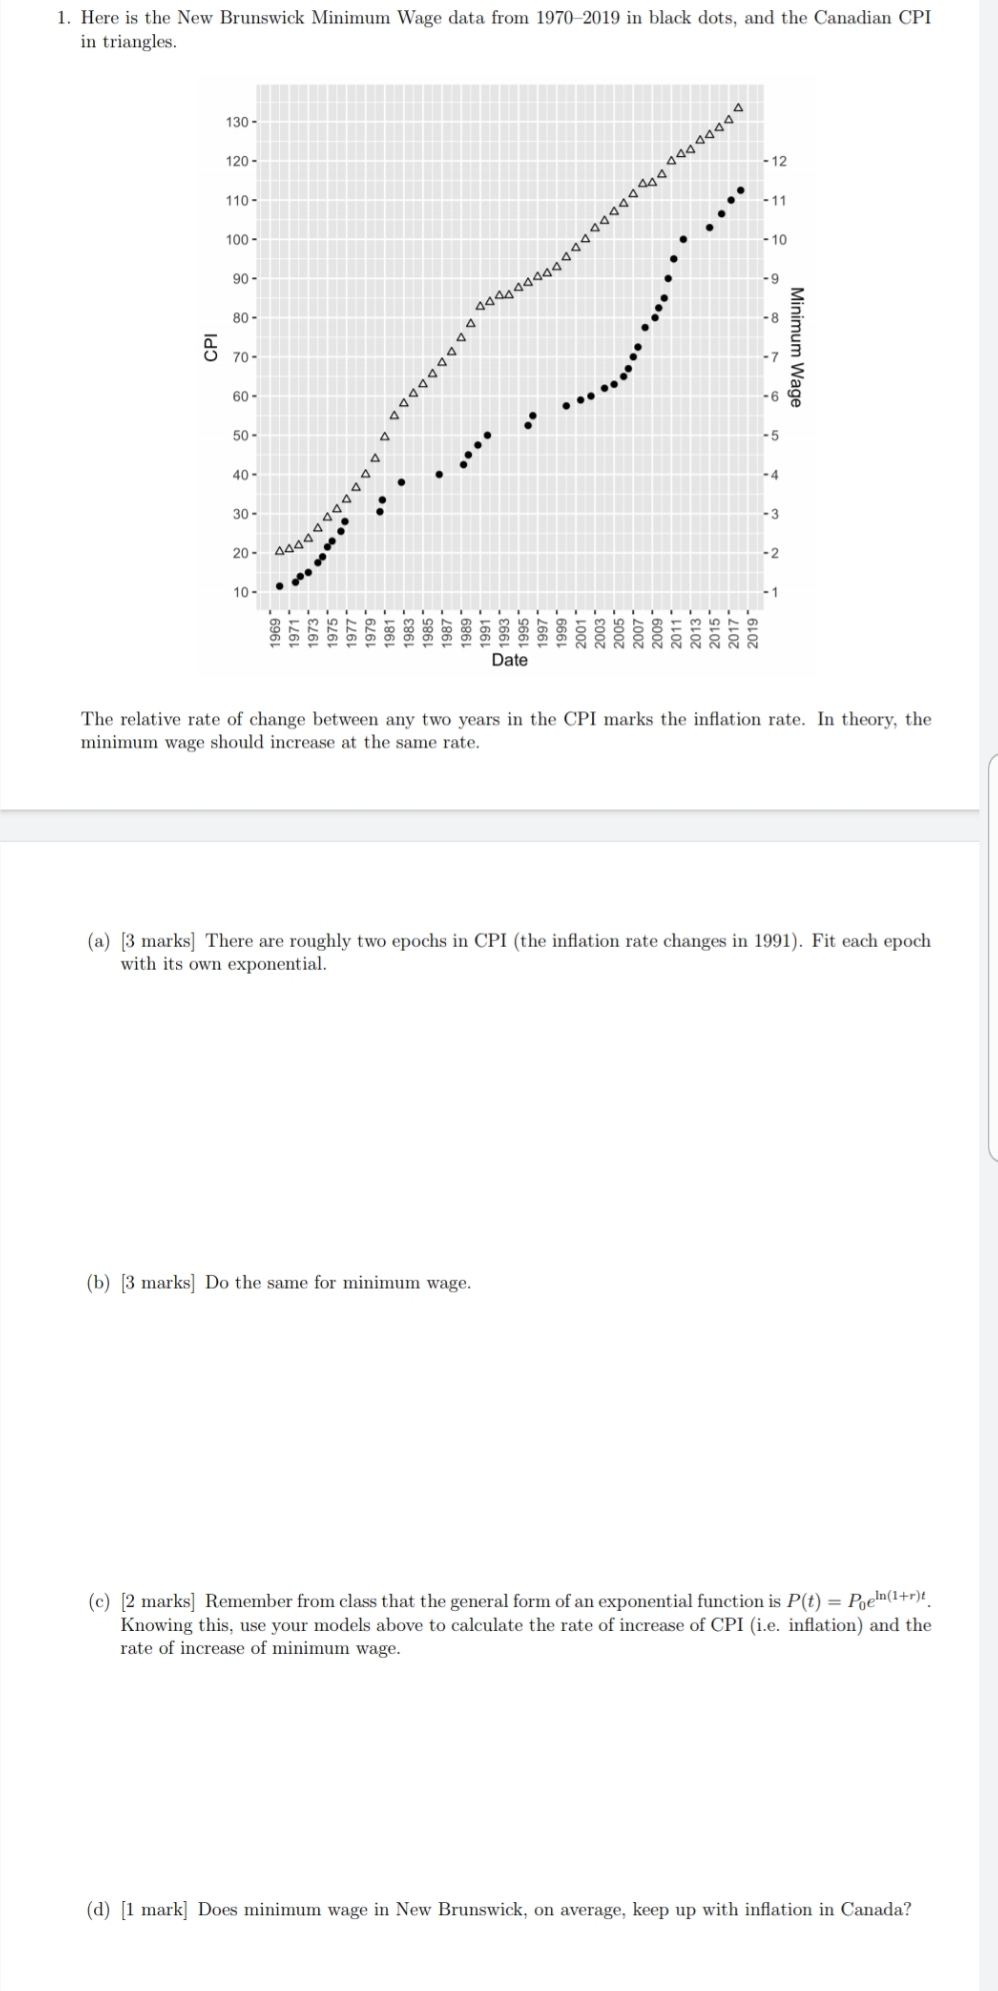
1. Here is the New Brunswick Minimum Wage data from 1970-2019 in black dots, and the Canadian CPI in triangles. 130- 120 - 1 110- 11 100- -10 90 - DDDDDDDDDDDDDDDDDDD BDDDDDDDDDDDD - 9 80 - CPI .. .. . ... . -8 70- 60 - - 6 Minimum Wage 50 - 4 4 40 - 30 20 - .. .. N 10- 1969 1971 - 1973 - 1975- 1985 1987 1989 1991 1993 1995 Date 1997 1999 2003 - 2005 - 2007 - 2009 2011 - 2013 2015 2017 2019 The relative rate of change between any two years in the CPI marks the inflation rate. In theory, the minimum wage should increase at the same rate. (a) [3 marks] There are roughly two epochs in CPI (the inflation rate changes in 1991). Fit each epoch with its own exponential. (b) [3 marks] Do the same for minimum wage. (c) [2 marks] Remember from class that the general form of an exponential function is P(t) = Poel(1+r)t. Knowing this, use your models above to calculate the rate of increase of CPI (i.e. inflation) and the rate of increase of minimum wage. (d) [1 mark] Does minimum wage in New Brunswick, on average, keep up with inflation in Canada
Step by Step Solution
There are 3 Steps involved in it

Get step-by-step solutions from verified subject matter experts