

Question: Spreadsheet Exercise- Forecasting Year Month March Summaries Forecast Last Year Variance to LY Budget Variance to Budget Group Weekday Rms ADR(G) 1,605 $216.80 2,358 $232.43
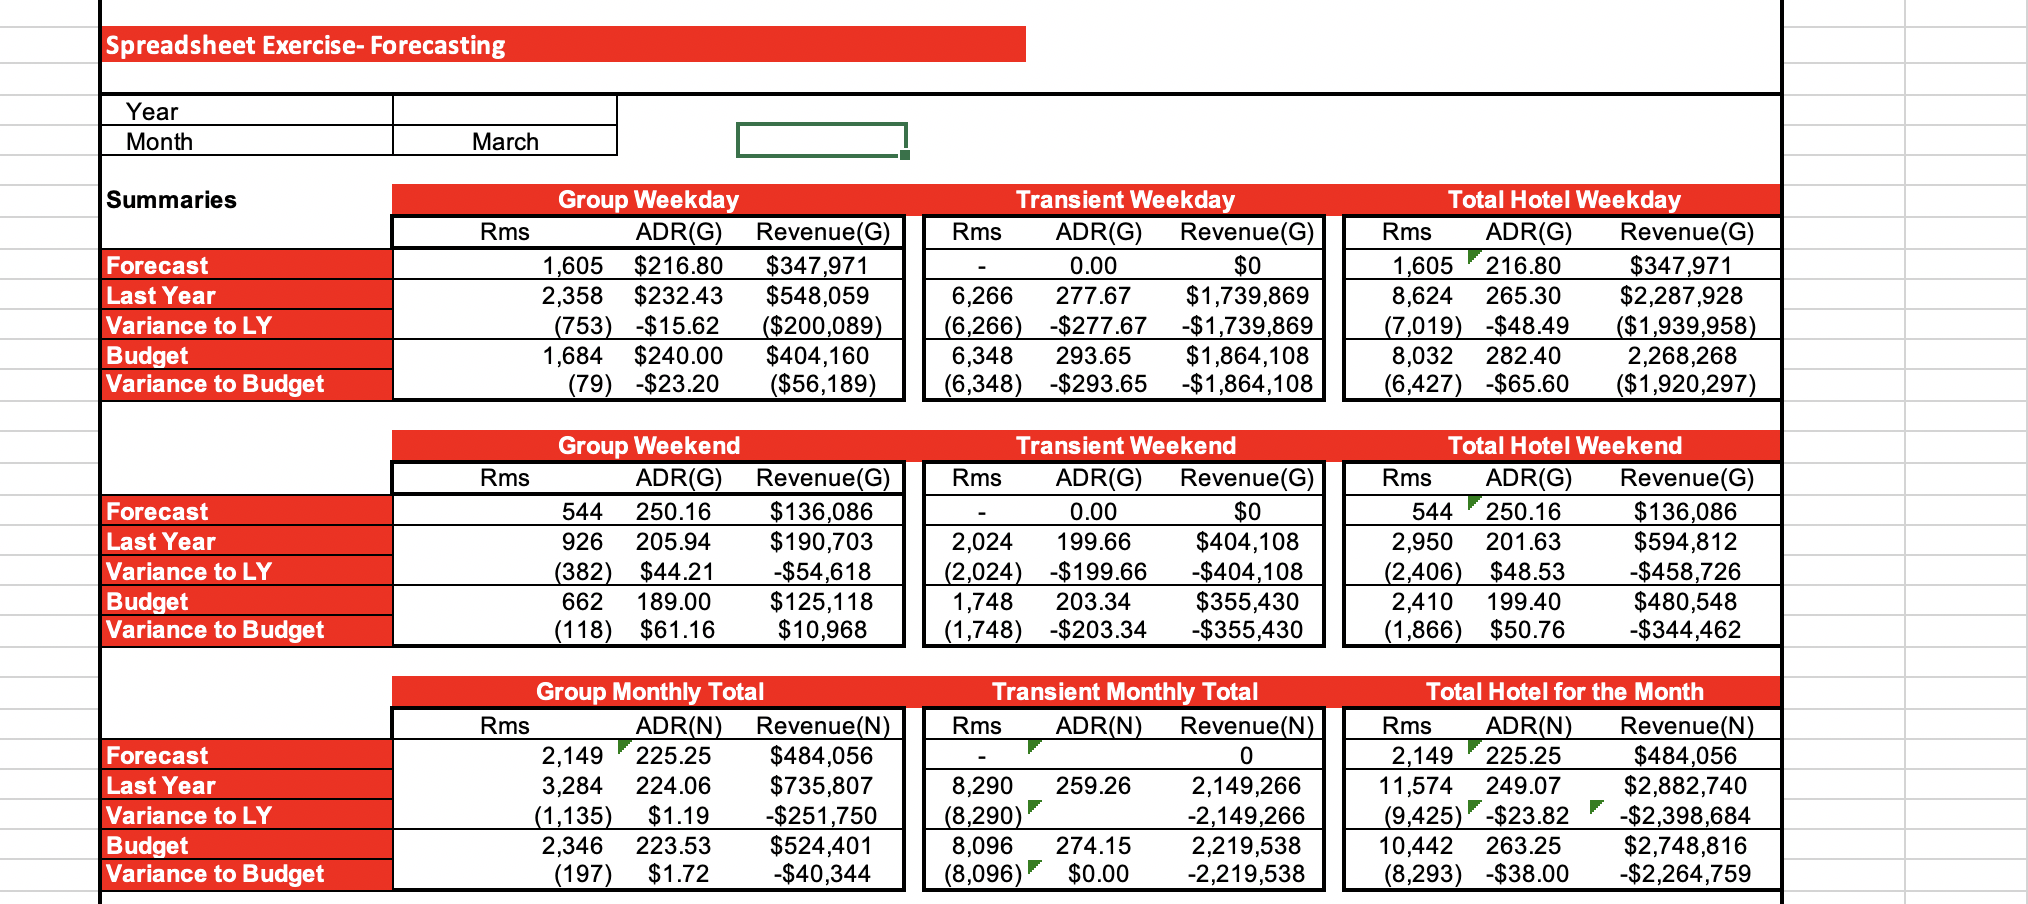
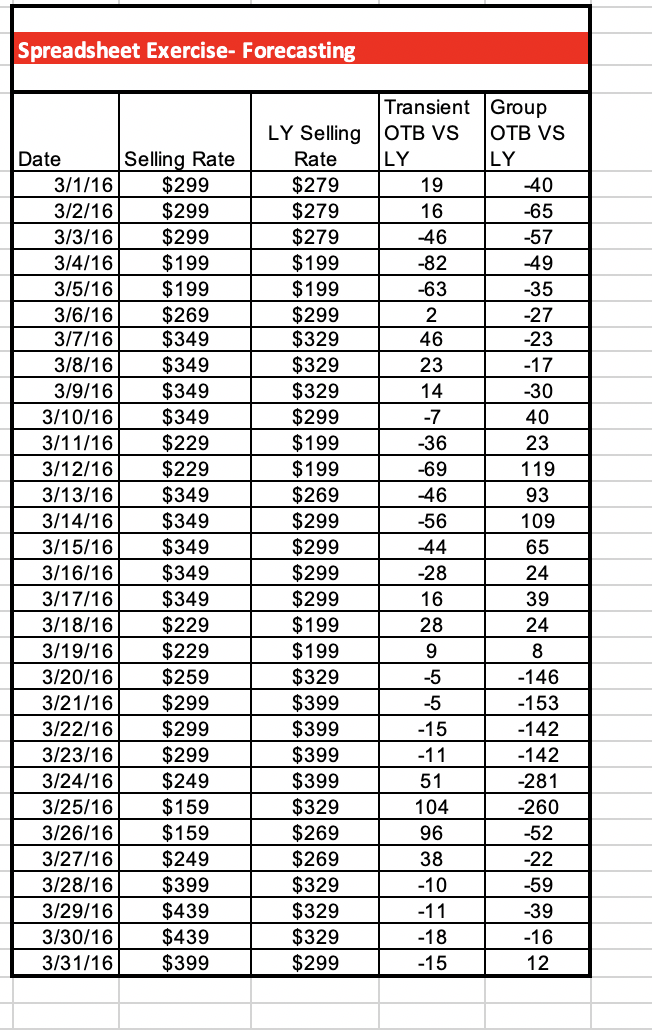
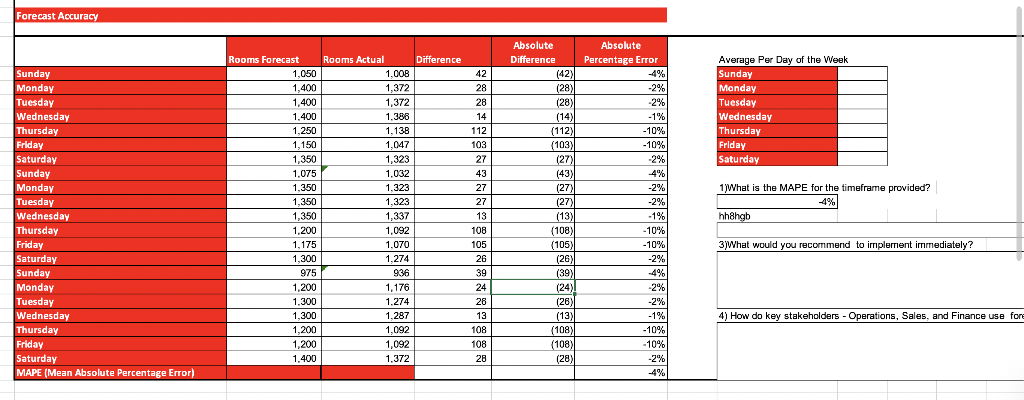
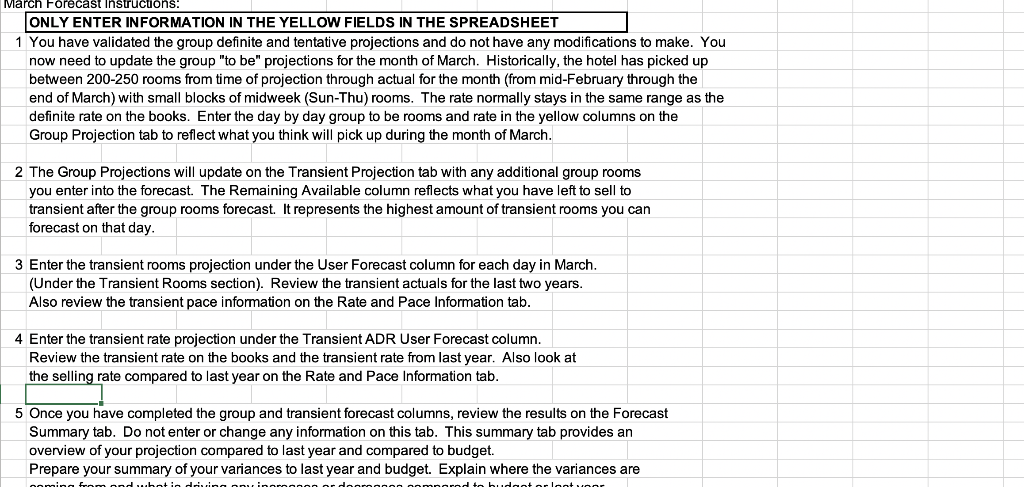
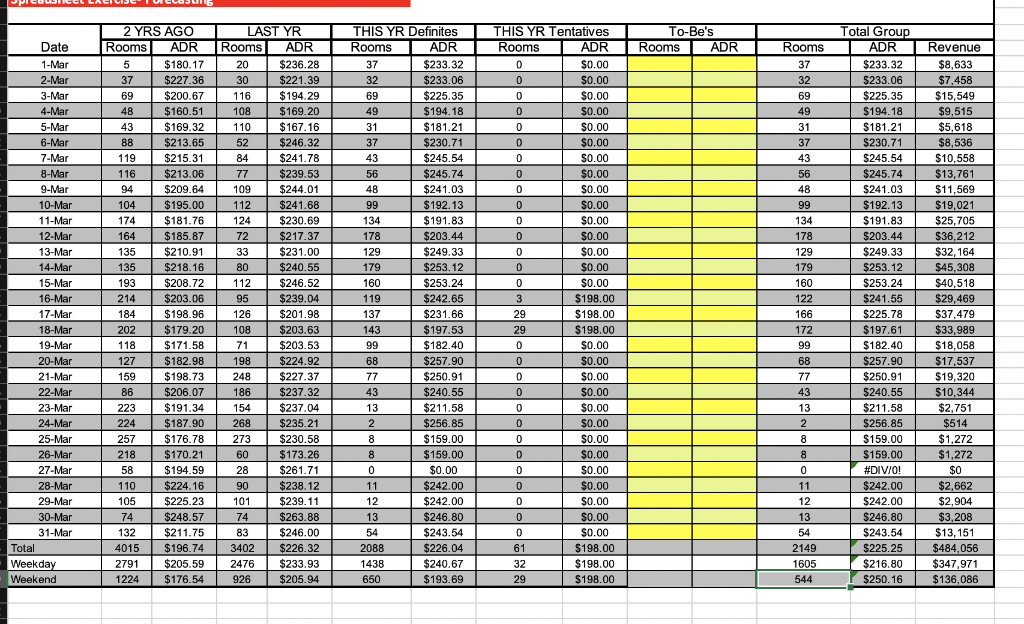
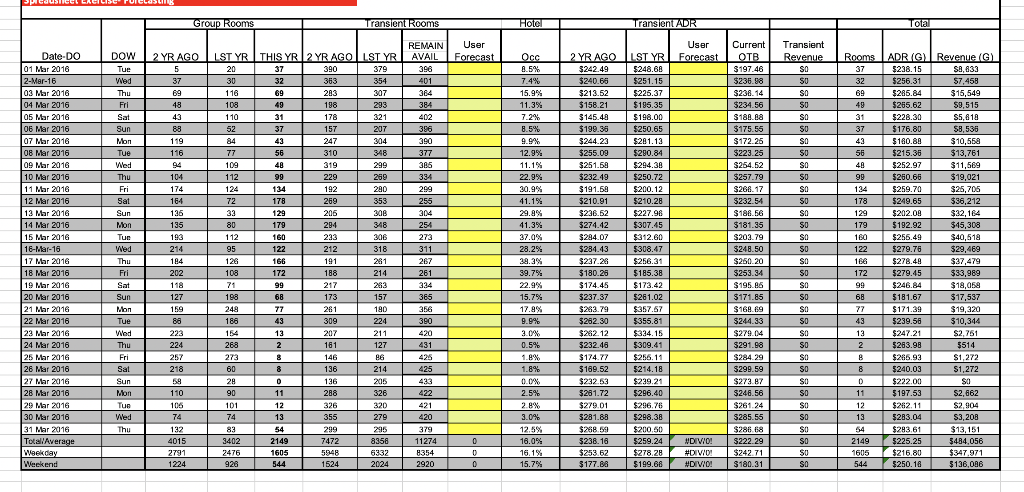
Spreadsheet Exercise- Forecasting Year Month March Summaries Forecast Last Year Variance to LY Budget Variance to Budget Group Weekday Rms ADR(G) 1,605 $216.80 2,358 $232.43 (753) -$15.62 1,684 $240.00 (79) $23.20 Revenue(G) $347,971 $548,059 ($200,089) $404,160 ($56,189) Transient Weekday Rms ADR(G) Revenue(G) 0.00 $0 6,266 277.67 $1,739,869 (6,266) -$277.67 -$1,739,869 6,348 293.65 $1,864,108 (6,348) -$293.65 -$1,864,108 Total Hotel Weekday Rms ADR(G) Revenue(G) 1,605 216.80 $347,971 8,624 265.30 $2,287,928 (7,019) -$48.49 ($1,939,958) 8,032 282.40 2,268,268 (6,427) $65.60 ($ 1,920,297) Rms Forecast Last Year Variance to LY Budget Variance to Budget Group Weekend ADR(G) Revenue(G) 544 250.16 $136,086 926 205.94 $190,703 (382) $44.21 -$54,618 662 189.00 $125,118 (118) $61.16 $10,968 Transient Weekend Rms ADR(G) Revenue(G) 0.00 $0 2,024 199.66 $404,108 (2,024) -$199.66 -$404,108 1,748 203.34 $355,430 (1,748) -$203.34 -$355,430 Total Hotel Weekend Rms ADR(G) Revenue(G 544 250.16 $136,086 2,950 201.63 $594,812 (2,406) $48.53 -$458,726 2,410 199.40 $480,548 (1,866) $50.76 -$344,462 Forecast Last Year Variance to LY Budget Variance to Budget Group Monthly Total Rms ADR(N) Revenue(N) 2,149 225.25 $484,056 3,284 224.06 $735,807 (1,135) $1.19 -$251,750 2,346 223.53 $524,401 (197) $1.72 -$40,344 Transient Monthly Total Rms ADR(N) Revenue(N) 0 8,290 259.26 2,149,266 (8,290) -2,149,266 8,096 274.15 2,219,538 (8,096) $0.00 -2,219,538 Total Hotel for the Month Rms ADR(N) Revenue(N) 2,149 225.25 $484,056 11,574 249.07 $2,882,740 (9,425) -$23.82 -$2,398,684 10,442 263.25 $2,748,816 (8,293) -$38.00 -$2,264,759 Spreadsheet Exercise- Forecasting Date 3/1/16 3/2/16 3/3/16 3/4/16 3/5/16 3/6/16 3/7/16 3/8/16 3/9/16 3/10/16 3/11/16 3/12/16 3/13/16 3/14/16 3/15/16 3/16/16 3/17/16 3/18/16 3/19/16 3/20/16 3/21/16 3/22/16 3/23/16 3/24/16 3/25/16 3/26/16 3/27/16 3/28/16 3/29/16 3/30/16 3/31/16 Selling Rate $299 $299 $299 $199 $199 $269 $349 $349 $349 $349 $229 $229 $349 $349 $349 $349 $349 $229 $229 $259 $299 $299 $299 $249 $159 $159 $249 $399 $439 $439 $399 Transient Group LY Selling OTB VS OTB VS Rate LY LY $279 19 -40 $279 16 -65 $279 -46 -57 $199 -82 -49 $199 -63 -35 $299 2 -27 $329 46 -23 $329 23 -17 $329 14 -30 $299 -7 40 $199 -36 23 $199 -69 119 $269 -46 93 $299 -56 109 $299 -44 65 $299 -28 24 $299 16 39 $199 28 24 $199 9 8 $329 -5 -146 $399 -5 -153 $399 -15 -142 $399 -11 -142 $399 51 -281 $329 104 -260 $269 96 -52 $269 38 -22 $329 -10 -59 $329 -11 -39 $329 -18 -16 $299 -15 12 Forecast Accuracy Difference Average Per Day of the Week Sunday Monday Tuesday Wednesday Thursday Friday Saturday Sunday Monday Tuesday Wednesday Thursday Friday Saturday Sunday Monday Tuesday Wednesday Thursday Friday Saturday Sunday Monday Tuesday Wednesday Thursday Friday Saturday MAPE (Mean Absolute Percentage Error) Rooms Forecast 1,050 1,400 1,400 1.400 1.250 1,150 1,350 1.075 1,350 1,350 1,350 1.200 1,175 1,300 975 1,200 1.300 1,300 1,200 1,200 1,400 Rooms Actual 1,008 1.372 1,372 1.386 1,138 1.047 1,323 1,032 1.323 1,323 1,337 1,092 1.070 1.274 936 1,176 1.274 1,287 1,092 1,092 1,372 42 28 28 14 112 103 27 43 27 27 13 108 105 2E 39 24 28 13 108 108 28 Absolute Difference (42) (28) (28 (14) (112) (103) (27) (43) (27) (27) (13) (108) (105) ) (26) (39) ( (24) (26) (13) (108) (108) (28) Absolute Percentage Error -4% -2% 2% 1% -1% -10% -10% -2% 4% -2% -2% -19 -10% -10% -2% % -4% -2% -2% -1% -10% -10% -2% -4% 1)What is the MAPE for the timeframe provided? % -4% hh8hgb 3)What would you recommend to implement immediately? 4) How do key stakeholders - Operations, Sales, and Finance use for rch Forecast Instructons: ONLY ENTER INFORMATION IN THE YELLOW FIELDS IN THE SPREADSHEET 1 You have validated the group definite and tentative projections and do not have any modifications to make. You now need to update the group "to be" projections for the month of March. Historically, the hotel has picked up between 200-250 rooms from time of projection through actual for the month (from mid-February through the end of March) with small blocks of midweek (Sun-Thu) rooms. The rate normally stays in the same range as the definite rate on the books. Enter the day by day group to be rooms and rate in the yellow columns on the Group Projection tab to reflect what you think will pick up during the month of March. 2 The Group Projections will update on the Transient Projection tab with any additional group rooms you enter into the forecast. The Remaining Available column reflects what you have left to sell to transient after the group rooms forecast. It represents the highest amount of transient rooms you can forecast on that day. 3 Enter the transient rooms projection under the User Forecast column for each day in March. (Under the Transient Rooms section). Review the transient actuals for the last two years. Also review the transient pace information on the Rate and Pace Information tab. 4 Enter the transient rate projection under the Transient ADR User Forecast column. Review the transient rate on the books and the transient rate from last year. Also look at the selling rate compared to last year on the Rate and Pace Information tab. 5 Once you have completed the group and transient forecast columns, review the results on the Forecast Summary tab. Do not enter change any information on this tab. This summary tab provides an overview of your projection compared to last year and compared to budget. Prepare your summary of your variances to last year and budget. Explain where the variances are from and what in driving hudant or lantunar To-Be's Rooms ADR $0.00 $0.00 Date 1-Mar 2-Mar 3-Mar 4-Mar . 5-Mar 6-Mar u 7-Mar . 8-Mar 9-Mar . 10-Mar var 11-Mar . 12-Mar 12 am 13-Mar w 14-Mar 15-Mar sem 16-Mar 42. 17-Mar 10 18-Mar 19-Mar 20-Mar 21-Mar 21-Mar 22-Mar 22 Mar 23-Mar 24-Mar 25-Mar 26-Mar 27-Mar 28-Mar 29-Mar 30-Mar 31-Mar Total Weekday Weekend 2 YRS AGO Rooms ADR 5 $180.17 37 $227.36 69 $200.67 48 $160.51 100.31 43 $169.32 88 $213.65 we 119 $215.31 w 116 $213.06 . 94 $209.64 104 $195.00 . I. 174 $181.76 - 164 $185.87 Shoo.o. 135 $210.91 10. 135 $218.16 21010 193 $208.72 214 $203.06 40 4400 od $198.96 184 202 200 $179.20 118 $171.58 127 159 109 $198.73 $ 86 $206.07 200.07 223 $191.34 wel. 224 $187.90 257 $176.78 218 $170.21 EO 58 $ 110 $224.16 105 $225.23 74 $248.57 132 $211.75 4015 $196.74 2791 $205.59 1224 $176.54 LAST YR Rooms ADR 20 $236.28 30 $221.39 116 $194.29 108 $169.20 103.20 110 $167.16 W.10 52 $246.32 84 $241.78 - re 77 $239.53 vo. 109 $244.01 e 112 $241.68 124 $230.69 vie 72 $217.37 33 $231.00 velice 80 $240.55 . 112 $246.52 CO 95 $239.04 49 126 $201.98 4204 100 na 2 108 $203.63 24 71 $203 52 $203.53 198 $224 92 $224.92 248 240 $227.37 186 $237.32 21.32 154 $237.04 21.09 268 $235.21 273 $230.58 60 $173.26 28 $261.71 90 $238.12 101 $239.11 74 $263.88 $ 83 $246.00 3402 $226.32 2476 $233.93 926 $205.94 THIS YR Definites Rooms ADR 37 $233.32 32 $233.06 69 $225.35 49 $194.18 19.10 31 $181.21 1.2 37 $230.71 43 $245.54 v 56 $245.74 48 $241.03 99 $192.13 Toile 134 $191.83 ne 178 $203.44 . 129 $249.33 179 $253.12 160 $253.24 440 C 119 $242.65 407 137 $231.66 5224 8 143 143 $197.53 og 99 $182.40 $ 68 68 $257.90 $ 77 $250.91 43 $240.55 $210.55 13 10 $211.58 211.00 2 $256.85 - 8 $159.00 8 8 $159.00 0 0 $0.00 14 11 $242.00 40 12 $242.00 13 13 $246.80 54 $243.54 2088 $226.04 1438 $240.67 650 $193.69 THIS YR Tentatives Rooms ADR 0 0 0 0 0 $0.00 0 $0.00 90.00 0 $0.00 vivy 0 $0.00 0 $0.00 0 $0.00 0 $0.00 0 $0.00 ... 0 $0.00 wow 0 $0.00 0 0 $0.00 0 $0.00 - 0 $0.00 ex 3 $198.00 20 29 $ 20 29 $ 0 en $0.00 0 SO $0.00 0 $0.00 0 $0.00 0 U $0.00 0.00 0 $0.00 0 $0.00 0 $0.00 0 $0.00 0 $0.00 0 Soon 0 $0.00 0 $0.00 61 $198.00 32 $198.00 29 $198.00 Rooms 37 32 69 49 70 31 37 43 56 48 99 134 178 129 179 160 190 122 166 172 20 99 68 77 43 43 13 Total Group ADR $233.32 $233.06 $225.35 $194.18 $181.21 012 $230.71 $245.54 $245.74 $241.03 $192.13 $191.83 $203.44 $249.33 voice $253.12 $253.24 ee $241.55 $225.78 295 2 4oze $197.61 $182.40 $257.90 $250.91 $240.55 270.00 $211.58 $211.58 $256.85 $159.00 $159.00 #DIV/0! $242.00 $242.00 $246.80 $243.54 $225.25 $216.80 $250.16 Revenue $8,633 $7,458 $15,549 $9,515 99.510 $5,618 $8,536 $10,558 $13,761 $11,569 So $19,021 ! $25,705 $36.212 0.12 $32,164 w $45,308 $40,518 $29,469 22.220 $37,479 es $33,989 $18.00 $18,058 $17,537 498.00 240262 $198.00 $182.98 $19,320 2 8 8 $194.59 $ U 11 12 13 54 2149 1605 544 $10,344 $2,751 $514 2014 $1,272 $1,272 $0 $2,662 2 BES $2,904 $3,208 $13,151 $484,056 $347,971 $136,086 UGLAUB Group Rooms transient Rooms Hotel Transient ADR Total Date-DO 01 Mar 2016 User Forecast 2-Mar-16 2 YR AGO 5 37 69 48 43 88 119 116 03 Mar 2016 04 Mar 2016 05 Mar 2016 06 Mar 2016 07 Mar 2016 08 Mar 2016 09 Mar 2016 10 Mar 2016 11 Mar 2016 12 Mar 2016 13 Mar 2016 14 Mar 2016 15 Mar 2016 16-Mar-16 17 Mar 2016 18 Mar 2016 19 Mar 2016 20 Mar 2016 21 Mar 2016 22 Mar 2016 23 Mar 2016 24 Mar 2016 25 Mar 2016 26 Mar 2016 27 Mar 2016 28 Mar 2016 29 Mar 2016 30 Mar 2016 31 Mar 2016 Total Average Weekday Weekend DOW Tue Wed Thu Fri Sat Sun Mon Tue Wed Thu Fri Sat Sun Mon Tun Wed Thu Fri Sat Sun Mon Tue Wed Thu Fri Sal Sun Mon TUR Wed Thu 104 174 164 136 135 193 214 184 202 118 127 159 88 223 224 257 218 LSTYR THIS YR THIS YR 2 YR AGO IST YR 20 37 390 379 30 32 353 354 116 69 283 307 108 49 198 293 110 31 178 321 52 37 157 207 84 43 247 304 77 56 310 348 109 48 319 299 112 99 229 259 124 134 192 290 72 178 269 353 33 129 206 308 80 179 294 348 112 160 233 306 95 122 212 318 126 166 191 281 108 172 188 214 71 99 217 283 198 68 173 157 248 77 261 180 188 43 309 224 154 13 207 211 268 2 2 161 127 273 8 146 B6 60 8 136 214 28 0 136 205 90 11 288 326 101 12 326 320 74 13 355 279 83 54 299 295 3402 2149 7472 8358 2476 1605 5948 6332 926 1524 2024 REMAIN AVAIL 396 401 364 384 402 396 390 377 385 334 299 255 304 254 273 311 267 261 334 365 356 390 420 431 424 425 Occ 8.5% 7.4% 15.9% 11.3% 7.2% 8.5% 9.9% 12.9% 11.1% 22.9% 30.9% 41.1% 29.9% 41.3% 37.0% 28.2% 39.3% 39.7% 22.9% 15.7% 17.9% 9.9% 2.0% 0.5% 1.8% 1.8% 0.0% 2.5% 2.8% 3.0% 12.5% 16.0% 16.1% 15.7% 2 YR AGO L STYR $242.49 $248.66 $240.66 $251.15 $213.52 $225.37 $158.21 $195.35 $145.48 $198.00 $199.38 $250.65 $ $244.23 $281.13 $255.09 $290.84 $251.54 $294.36 $232.49 $250.72 $191.58 $200.12 $210.91 $210.28 $236.52 $227.98 $274.42 $307.45 $284.07 $312.60 $284.43 $308.47 $23726 $256.31 $180.26 $185.38 $174.45 $173.42 $237.37 $261.02 $263.79 $357.57 $282.30 $355.81 $262.12 $334.15 3232.48 $309.41 $174.77 $255.11 $169.52 5214.18 $232.53 $239.21 $281.72 $286.40 $279.01 $296.76 $ $281.88 $298.38 $268.59 $200.00 3238.16 $ $259.24 $253.62 $278.28 $177.88 $199.68 User Current Forecast OTB $197.46 $235.98 $238.14 $234.56 $188.88 $175.55 $172.25 $223.25 $254.52 $257.79 $268.17 $232.54 $186.56 $181.35 $202.79 $248.50 $250.20 $253.34 $195.85 $171.85 $168.69 $244.33 $279.04 $291.98 $284.29 $299.59 $273.87 $248.56 $261 24 $285.55 $286.68 NDIVIO! $222.29 #DIV/0! $242.71 #DIV/0! $180.31 Transient Revenue SO SU SO SU SO SU SO $0 SO SO SO SO SO SO SO SO SO SO SO SO SO SO SO SO SO SO SO SO SO SO SO SO $0 SO Rooms ADRG Revenue (G) ) 37 $238.15 S8,833 32 $256.31 $7,458 69 $285.84 $15,549 49 $265.62 $9,515 31 $228.30 S5,818 37 $176.80 $8,536 43 $180.88 $10,558 56 $215.30 $13,761 48 $252.97 $11,589 99 $260.68 $19,021 134 $259.70 $25,705 178 $249.65 $36,212 129 $202.08 $32,164 179 $192.92 $45,308 180 $255.49 $40,518 122 $279.78 $29,469 166 $278.48 $37,479 172 $279.45 $33,989 99 $246.84 $18,05 68 $181.67 $17,537 77 $171.39 $19,320 43 $239.58 $10,344 13 $247.21 $2,751 2 $283.98 5514 B $265.93 $1,272 8 8 $240.03 $1,272 D $222.00 SO 11 $197.53 $2,662 12 $262.11 $2.904 $ 13 $283.04 $3,208 54 $293.61 $13,151 2149 $225.25 5484,056 1605 $216.80 $347.971 544 $250.16 $ 136,086 110 105 74 132 4015 2791 1224 422 421 420 379 11274 8354 2920 0 0 0 544 Spreadsheet Exercise- Forecasting Year Month March Summaries Forecast Last Year Variance to LY Budget Variance to Budget Group Weekday Rms ADR(G) 1,605 $216.80 2,358 $232.43 (753) -$15.62 1,684 $240.00 (79) $23.20 Revenue(G) $347,971 $548,059 ($200,089) $404,160 ($56,189) Transient Weekday Rms ADR(G) Revenue(G) 0.00 $0 6,266 277.67 $1,739,869 (6,266) -$277.67 -$1,739,869 6,348 293.65 $1,864,108 (6,348) -$293.65 -$1,864,108 Total Hotel Weekday Rms ADR(G) Revenue(G) 1,605 216.80 $347,971 8,624 265.30 $2,287,928 (7,019) -$48.49 ($1,939,958) 8,032 282.40 2,268,268 (6,427) $65.60 ($ 1,920,297) Rms Forecast Last Year Variance to LY Budget Variance to Budget Group Weekend ADR(G) Revenue(G) 544 250.16 $136,086 926 205.94 $190,703 (382) $44.21 -$54,618 662 189.00 $125,118 (118) $61.16 $10,968 Transient Weekend Rms ADR(G) Revenue(G) 0.00 $0 2,024 199.66 $404,108 (2,024) -$199.66 -$404,108 1,748 203.34 $355,430 (1,748) -$203.34 -$355,430 Total Hotel Weekend Rms ADR(G) Revenue(G 544 250.16 $136,086 2,950 201.63 $594,812 (2,406) $48.53 -$458,726 2,410 199.40 $480,548 (1,866) $50.76 -$344,462 Forecast Last Year Variance to LY Budget Variance to Budget Group Monthly Total Rms ADR(N) Revenue(N) 2,149 225.25 $484,056 3,284 224.06 $735,807 (1,135) $1.19 -$251,750 2,346 223.53 $524,401 (197) $1.72 -$40,344 Transient Monthly Total Rms ADR(N) Revenue(N) 0 8,290 259.26 2,149,266 (8,290) -2,149,266 8,096 274.15 2,219,538 (8,096) $0.00 -2,219,538 Total Hotel for the Month Rms ADR(N) Revenue(N) 2,149 225.25 $484,056 11,574 249.07 $2,882,740 (9,425) -$23.82 -$2,398,684 10,442 263.25 $2,748,816 (8,293) -$38.00 -$2,264,759 Spreadsheet Exercise- Forecasting Date 3/1/16 3/2/16 3/3/16 3/4/16 3/5/16 3/6/16 3/7/16 3/8/16 3/9/16 3/10/16 3/11/16 3/12/16 3/13/16 3/14/16 3/15/16 3/16/16 3/17/16 3/18/16 3/19/16 3/20/16 3/21/16 3/22/16 3/23/16 3/24/16 3/25/16 3/26/16 3/27/16 3/28/16 3/29/16 3/30/16 3/31/16 Selling Rate $299 $299 $299 $199 $199 $269 $349 $349 $349 $349 $229 $229 $349 $349 $349 $349 $349 $229 $229 $259 $299 $299 $299 $249 $159 $159 $249 $399 $439 $439 $399 Transient Group LY Selling OTB VS OTB VS Rate LY LY $279 19 -40 $279 16 -65 $279 -46 -57 $199 -82 -49 $199 -63 -35 $299 2 -27 $329 46 -23 $329 23 -17 $329 14 -30 $299 -7 40 $199 -36 23 $199 -69 119 $269 -46 93 $299 -56 109 $299 -44 65 $299 -28 24 $299 16 39 $199 28 24 $199 9 8 $329 -5 -146 $399 -5 -153 $399 -15 -142 $399 -11 -142 $399 51 -281 $329 104 -260 $269 96 -52 $269 38 -22 $329 -10 -59 $329 -11 -39 $329 -18 -16 $299 -15 12 Forecast Accuracy Difference Average Per Day of the Week Sunday Monday Tuesday Wednesday Thursday Friday Saturday Sunday Monday Tuesday Wednesday Thursday Friday Saturday Sunday Monday Tuesday Wednesday Thursday Friday Saturday Sunday Monday Tuesday Wednesday Thursday Friday Saturday MAPE (Mean Absolute Percentage Error) Rooms Forecast 1,050 1,400 1,400 1.400 1.250 1,150 1,350 1.075 1,350 1,350 1,350 1.200 1,175 1,300 975 1,200 1.300 1,300 1,200 1,200 1,400 Rooms Actual 1,008 1.372 1,372 1.386 1,138 1.047 1,323 1,032 1.323 1,323 1,337 1,092 1.070 1.274 936 1,176 1.274 1,287 1,092 1,092 1,372 42 28 28 14 112 103 27 43 27 27 13 108 105 2E 39 24 28 13 108 108 28 Absolute Difference (42) (28) (28 (14) (112) (103) (27) (43) (27) (27) (13) (108) (105) ) (26) (39) ( (24) (26) (13) (108) (108) (28) Absolute Percentage Error -4% -2% 2% 1% -1% -10% -10% -2% 4% -2% -2% -19 -10% -10% -2% % -4% -2% -2% -1% -10% -10% -2% -4% 1)What is the MAPE for the timeframe provided? % -4% hh8hgb 3)What would you recommend to implement immediately? 4) How do key stakeholders - Operations, Sales, and Finance use for rch Forecast Instructons: ONLY ENTER INFORMATION IN THE YELLOW FIELDS IN THE SPREADSHEET 1 You have validated the group definite and tentative projections and do not have any modifications to make. You now need to update the group "to be" projections for the month of March. Historically, the hotel has picked up between 200-250 rooms from time of projection through actual for the month (from mid-February through the end of March) with small blocks of midweek (Sun-Thu) rooms. The rate normally stays in the same range as the definite rate on the books. Enter the day by day group to be rooms and rate in the yellow columns on the Group Projection tab to reflect what you think will pick up during the month of March. 2 The Group Projections will update on the Transient Projection tab with any additional group rooms you enter into the forecast. The Remaining Available column reflects what you have left to sell to transient after the group rooms forecast. It represents the highest amount of transient rooms you can forecast on that day. 3 Enter the transient rooms projection under the User Forecast column for each day in March. (Under the Transient Rooms section). Review the transient actuals for the last two years. Also review the transient pace information on the Rate and Pace Information tab. 4 Enter the transient rate projection under the Transient ADR User Forecast column. Review the transient rate on the books and the transient rate from last year. Also look at the selling rate compared to last year on the Rate and Pace Information tab. 5 Once you have completed the group and transient forecast columns, review the results on the Forecast Summary tab. Do not enter change any information on this tab. This summary tab provides an overview of your projection compared to last year and compared to budget. Prepare your summary of your variances to last year and budget. Explain where the variances are from and what in driving hudant or lantunar To-Be's Rooms ADR $0.00 $0.00 Date 1-Mar 2-Mar 3-Mar 4-Mar . 5-Mar 6-Mar u 7-Mar . 8-Mar 9-Mar . 10-Mar var 11-Mar . 12-Mar 12 am 13-Mar w 14-Mar 15-Mar sem 16-Mar 42. 17-Mar 10 18-Mar 19-Mar 20-Mar 21-Mar 21-Mar 22-Mar 22 Mar 23-Mar 24-Mar 25-Mar 26-Mar 27-Mar 28-Mar 29-Mar 30-Mar 31-Mar Total Weekday Weekend 2 YRS AGO Rooms ADR 5 $180.17 37 $227.36 69 $200.67 48 $160.51 100.31 43 $169.32 88 $213.65 we 119 $215.31 w 116 $213.06 . 94 $209.64 104 $195.00 . I. 174 $181.76 - 164 $185.87 Shoo.o. 135 $210.91 10. 135 $218.16 21010 193 $208.72 214 $203.06 40 4400 od $198.96 184 202 200 $179.20 118 $171.58 127 159 109 $198.73 $ 86 $206.07 200.07 223 $191.34 wel. 224 $187.90 257 $176.78 218 $170.21 EO 58 $ 110 $224.16 105 $225.23 74 $248.57 132 $211.75 4015 $196.74 2791 $205.59 1224 $176.54 LAST YR Rooms ADR 20 $236.28 30 $221.39 116 $194.29 108 $169.20 103.20 110 $167.16 W.10 52 $246.32 84 $241.78 - re 77 $239.53 vo. 109 $244.01 e 112 $241.68 124 $230.69 vie 72 $217.37 33 $231.00 velice 80 $240.55 . 112 $246.52 CO 95 $239.04 49 126 $201.98 4204 100 na 2 108 $203.63 24 71 $203 52 $203.53 198 $224 92 $224.92 248 240 $227.37 186 $237.32 21.32 154 $237.04 21.09 268 $235.21 273 $230.58 60 $173.26 28 $261.71 90 $238.12 101 $239.11 74 $263.88 $ 83 $246.00 3402 $226.32 2476 $233.93 926 $205.94 THIS YR Definites Rooms ADR 37 $233.32 32 $233.06 69 $225.35 49 $194.18 19.10 31 $181.21 1.2 37 $230.71 43 $245.54 v 56 $245.74 48 $241.03 99 $192.13 Toile 134 $191.83 ne 178 $203.44 . 129 $249.33 179 $253.12 160 $253.24 440 C 119 $242.65 407 137 $231.66 5224 8 143 143 $197.53 og 99 $182.40 $ 68 68 $257.90 $ 77 $250.91 43 $240.55 $210.55 13 10 $211.58 211.00 2 $256.85 - 8 $159.00 8 8 $159.00 0 0 $0.00 14 11 $242.00 40 12 $242.00 13 13 $246.80 54 $243.54 2088 $226.04 1438 $240.67 650 $193.69 THIS YR Tentatives Rooms ADR 0 0 0 0 0 $0.00 0 $0.00 90.00 0 $0.00 vivy 0 $0.00 0 $0.00 0 $0.00 0 $0.00 0 $0.00 ... 0 $0.00 wow 0 $0.00 0 0 $0.00 0 $0.00 - 0 $0.00 ex 3 $198.00 20 29 $ 20 29 $ 0 en $0.00 0 SO $0.00 0 $0.00 0 $0.00 0 U $0.00 0.00 0 $0.00 0 $0.00 0 $0.00 0 $0.00 0 $0.00 0 Soon 0 $0.00 0 $0.00 61 $198.00 32 $198.00 29 $198.00 Rooms 37 32 69 49 70 31 37 43 56 48 99 134 178 129 179 160 190 122 166 172 20 99 68 77 43 43 13 Total Group ADR $233.32 $233.06 $225.35 $194.18 $181.21 012 $230.71 $245.54 $245.74 $241.03 $192.13 $191.83 $203.44 $249.33 voice $253.12 $253.24 ee $241.55 $225.78 295 2 4oze $197.61 $182.40 $257.90 $250.91 $240.55 270.00 $211.58 $211.58 $256.85 $159.00 $159.00 #DIV/0! $242.00 $242.00 $246.80 $243.54 $225.25 $216.80 $250.16 Revenue $8,633 $7,458 $15,549 $9,515 99.510 $5,618 $8,536 $10,558 $13,761 $11,569 So $19,021 ! $25,705 $36.212 0.12 $32,164 w $45,308 $40,518 $29,469 22.220 $37,479 es $33,989 $18.00 $18,058 $17,537 498.00 240262 $198.00 $182.98 $19,320 2 8 8 $194.59 $ U 11 12 13 54 2149 1605 544 $10,344 $2,751 $514 2014 $1,272 $1,272 $0 $2,662 2 BES $2,904 $3,208 $13,151 $484,056 $347,971 $136,086 UGLAUB Group Rooms transient Rooms Hotel Transient ADR Total Date-DO 01 Mar 2016 User Forecast 2-Mar-16 2 YR AGO 5 37 69 48 43 88 119 116 03 Mar 2016 04 Mar 2016 05 Mar 2016 06 Mar 2016 07 Mar 2016 08 Mar 2016 09 Mar 2016 10 Mar 2016 11 Mar 2016 12 Mar 2016 13 Mar 2016 14 Mar 2016 15 Mar 2016 16-Mar-16 17 Mar 2016 18 Mar 2016 19 Mar 2016 20 Mar 2016 21 Mar 2016 22 Mar 2016 23 Mar 2016 24 Mar 2016 25 Mar 2016 26 Mar 2016 27 Mar 2016 28 Mar 2016 29 Mar 2016 30 Mar 2016 31 Mar 2016 Total Average Weekday Weekend DOW Tue Wed Thu Fri Sat Sun Mon Tue Wed Thu Fri Sat Sun Mon Tun Wed Thu Fri Sat Sun Mon Tue Wed Thu Fri Sal Sun Mon TUR Wed Thu 104 174 164 136 135 193 214 184 202 118 127 159 88 223 224 257 218 LSTYR THIS YR THIS YR 2 YR AGO IST YR 20 37 390 379 30 32 353 354 116 69 283 307 108 49 198 293 110 31 178 321 52 37 157 207 84 43 247 304 77 56 310 348 109 48 319 299 112 99 229 259 124 134 192 290 72 178 269 353 33 129 206 308 80 179 294 348 112 160 233 306 95 122 212 318 126 166 191 281 108 172 188 214 71 99 217 283 198 68 173 157 248 77 261 180 188 43 309 224 154 13 207 211 268 2 2 161 127 273 8 146 B6 60 8 136 214 28 0 136 205 90 11 288 326 101 12 326 320 74 13 355 279 83 54 299 295 3402 2149 7472 8358 2476 1605 5948 6332 926 1524 2024 REMAIN AVAIL 396 401 364 384 402 396 390 377 385 334 299 255 304 254 273 311 267 261 334 365 356 390 420 431 424 425 Occ 8.5% 7.4% 15.9% 11.3% 7.2% 8.5% 9.9% 12.9% 11.1% 22.9% 30.9% 41.1% 29.9% 41.3% 37.0% 28.2% 39.3% 39.7% 22.9% 15.7% 17.9% 9.9% 2.0% 0.5% 1.8% 1.8% 0.0% 2.5% 2.8% 3.0% 12.5% 16.0% 16.1% 15.7% 2 YR AGO L STYR $242.49 $248.66 $240.66 $251.15 $213.52 $225.37 $158.21 $195.35 $145.48 $198.00 $199.38 $250.65 $ $244.23 $281.13 $255.09 $290.84 $251.54 $294.36 $232.49 $250.72 $191.58 $200.12 $210.91 $210.28 $236.52 $227.98 $274.42 $307.45 $284.07 $312.60 $284.43 $308.47 $23726 $256.31 $180.26 $185.38 $174.45 $173.42 $237.37 $261.02 $263.79 $357.57 $282.30 $355.81 $262.12 $334.15 3232.48 $309.41 $174.77 $255.11 $169.52 5214.18 $232.53 $239.21 $281.72 $286.40 $279.01 $296.76 $ $281.88 $298.38 $268.59 $200.00 3238.16 $ $259.24 $253.62 $278.28 $177.88 $199.68 User Current Forecast OTB $197.46 $235.98 $238.14 $234.56 $188.88 $175.55 $172.25 $223.25 $254.52 $257.79 $268.17 $232.54 $186.56 $181.35 $202.79 $248.50 $250.20 $253.34 $195.85 $171.85 $168.69 $244.33 $279.04 $291.98 $284.29 $299.59 $273.87 $248.56 $261 24 $285.55 $286.68 NDIVIO! $222.29 #DIV/0! $242.71 #DIV/0! $180.31 Transient Revenue SO SU SO SU SO SU SO $0 SO SO SO SO SO SO SO SO SO SO SO SO SO SO SO SO SO SO SO SO SO SO SO SO $0 SO Rooms ADRG Revenue (G) ) 37 $238.15 S8,833 32 $256.31 $7,458 69 $285.84 $15,549 49 $265.62 $9,515 31 $228.30 S5,818 37 $176.80 $8,536 43 $180.88 $10,558 56 $215.30 $13,761 48 $252.97 $11,589 99 $260.68 $19,021 134 $259.70 $25,705 178 $249.65 $36,212 129 $202.08 $32,164 179 $192.92 $45,308 180 $255.49 $40,518 122 $279.78 $29,469 166 $278.48 $37,479 172 $279.45 $33,989 99 $246.84 $18,05 68 $181.67 $17,537 77 $171.39 $19,320 43 $239.58 $10,344 13 $247.21 $2,751 2 $283.98 5514 B $265.93 $1,272 8 8 $240.03 $1,272 D $222.00 SO 11 $197.53 $2,662 12 $262.11 $2.904 $ 13 $283.04 $3,208 54 $293.61 $13,151 2149 $225.25 5484,056 1605 $216.80 $347.971 544 $250.16 $ 136,086 110 105 74 132 4015 2791 1224 422 421 420 379 11274 8354 2920 0 0 0 544
Step by Step Solution
There are 3 Steps involved in it

Get step-by-step solutions from verified subject matter experts