

Question: SPSS uestion 1 University students learn rather quickly that the better their grade point average (GPA), the better their chances of landing good jobs upon
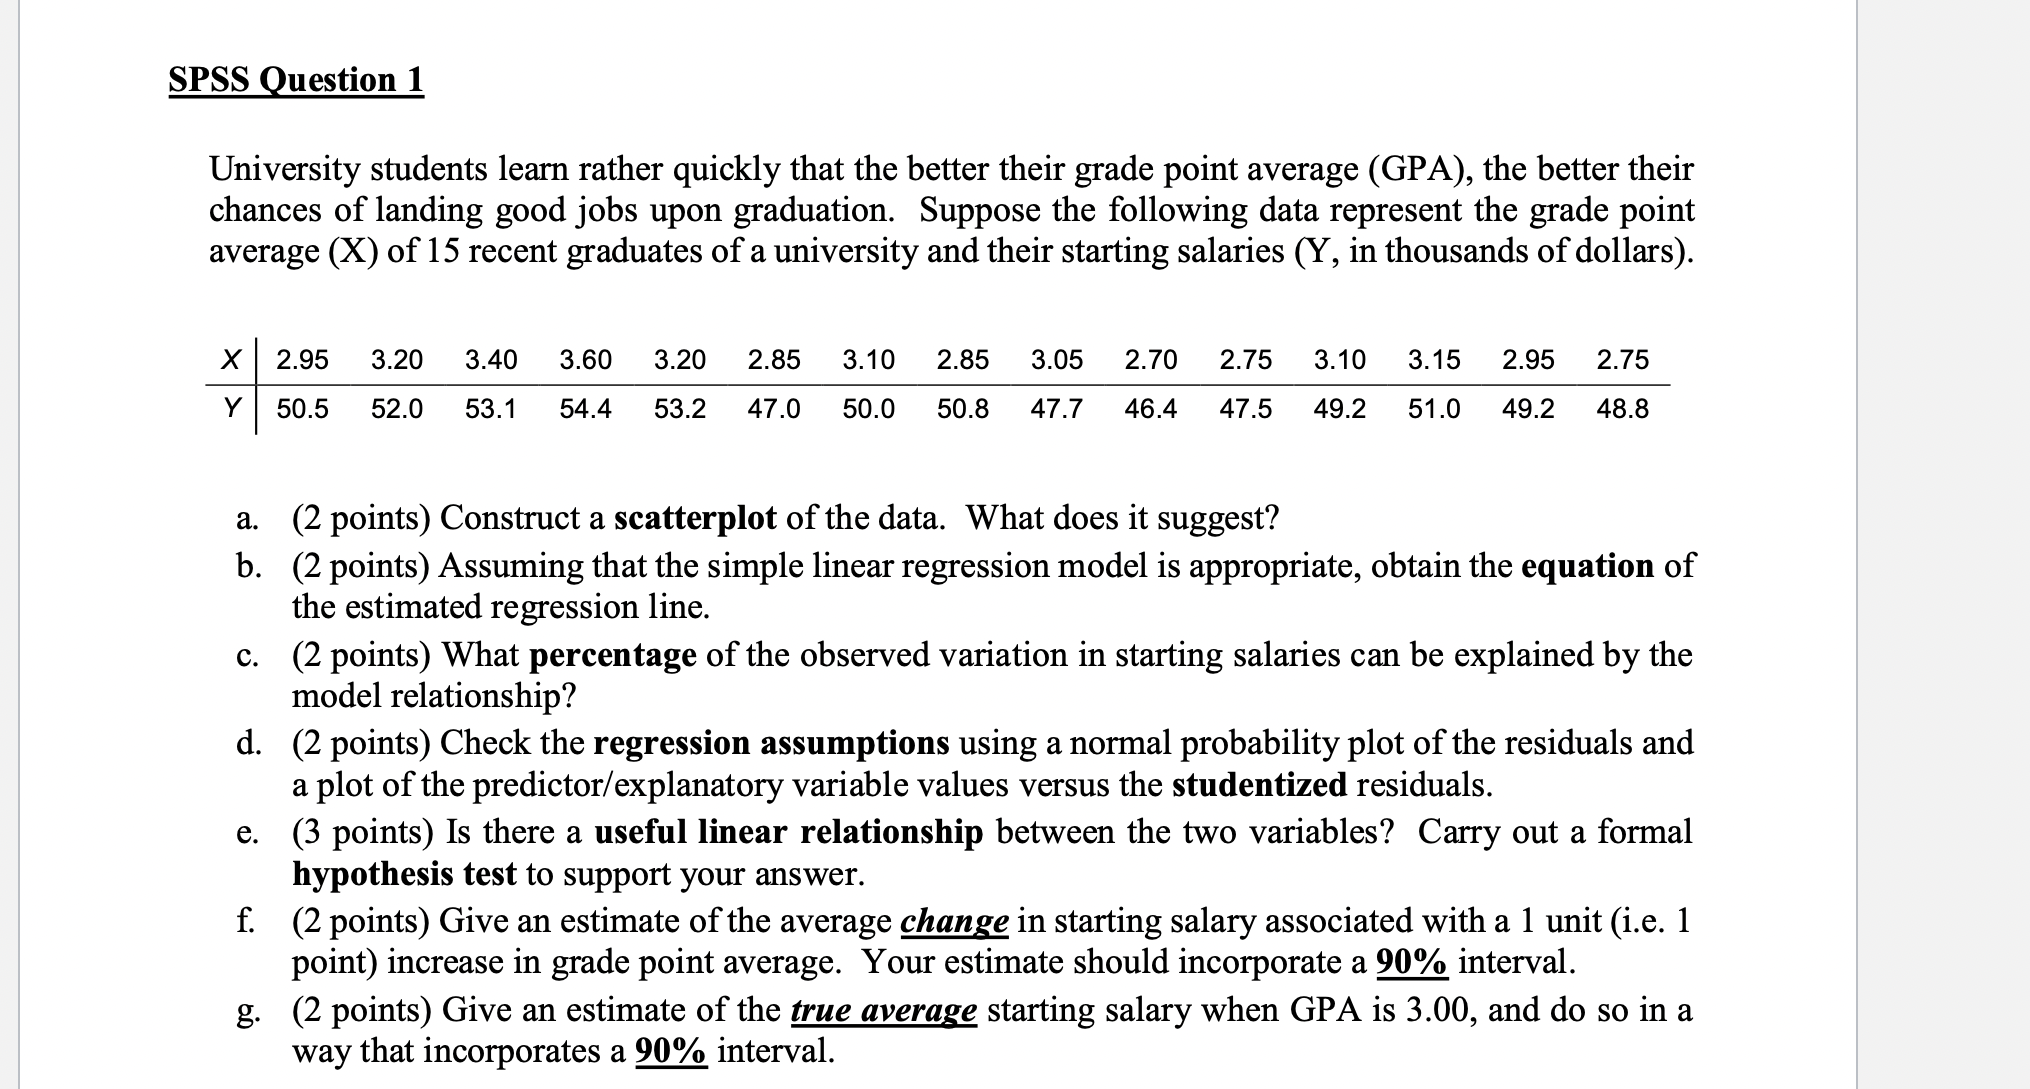
SPSS uestion 1 University students learn rather quickly that the better their grade point average (GPA), the better their chances of landing good jobs upon graduation. Suppose the following data represent the grade point average (X) of 15 recent graduates of a university and their starting salaries (Y, in thousands of dollars). X 2.95 3.20 3.40 3.60 3.20 2.85 3.10 2.85 3.05 2.70 2.75 3.10 3.15 2.95 2.75 Y 50.5 52.0 53.1 54.4 53.2 47.0 50.0 50.8 47.7 46.4 47.5 49.2 51.0 49.2 48.8 P (2 points) Construct a scatterplot of the data. What does it suggest? (2 points) Assuming that the simple linear regression model is appropriate, obtain the equation of the estimated regression line. (2 points) What percentage of the observed variation in starting salaries can be explained by the model relationship? (2 points) Check the regression assumptions using a normal probability plot of the residuals and a plot of the predictor/ explanatory variable values versus the studentized residuals. (3 points) Is there a useful linear relationship between the two variables? Carry out a formal hypothesis test to support your answer. (2 points) Give an estimate of the average change in starting salary associated with a 1 unit (i.e. 1 point) increase in grade point average. Your estimate should incorporate a 90% interval. (2 points) Give an estimate of the true average starting salary when GPA is 3.00, and do so in a way that incorporates a 90% interval
Step by Step Solution
There are 3 Steps involved in it

Get step-by-step solutions from verified subject matter experts