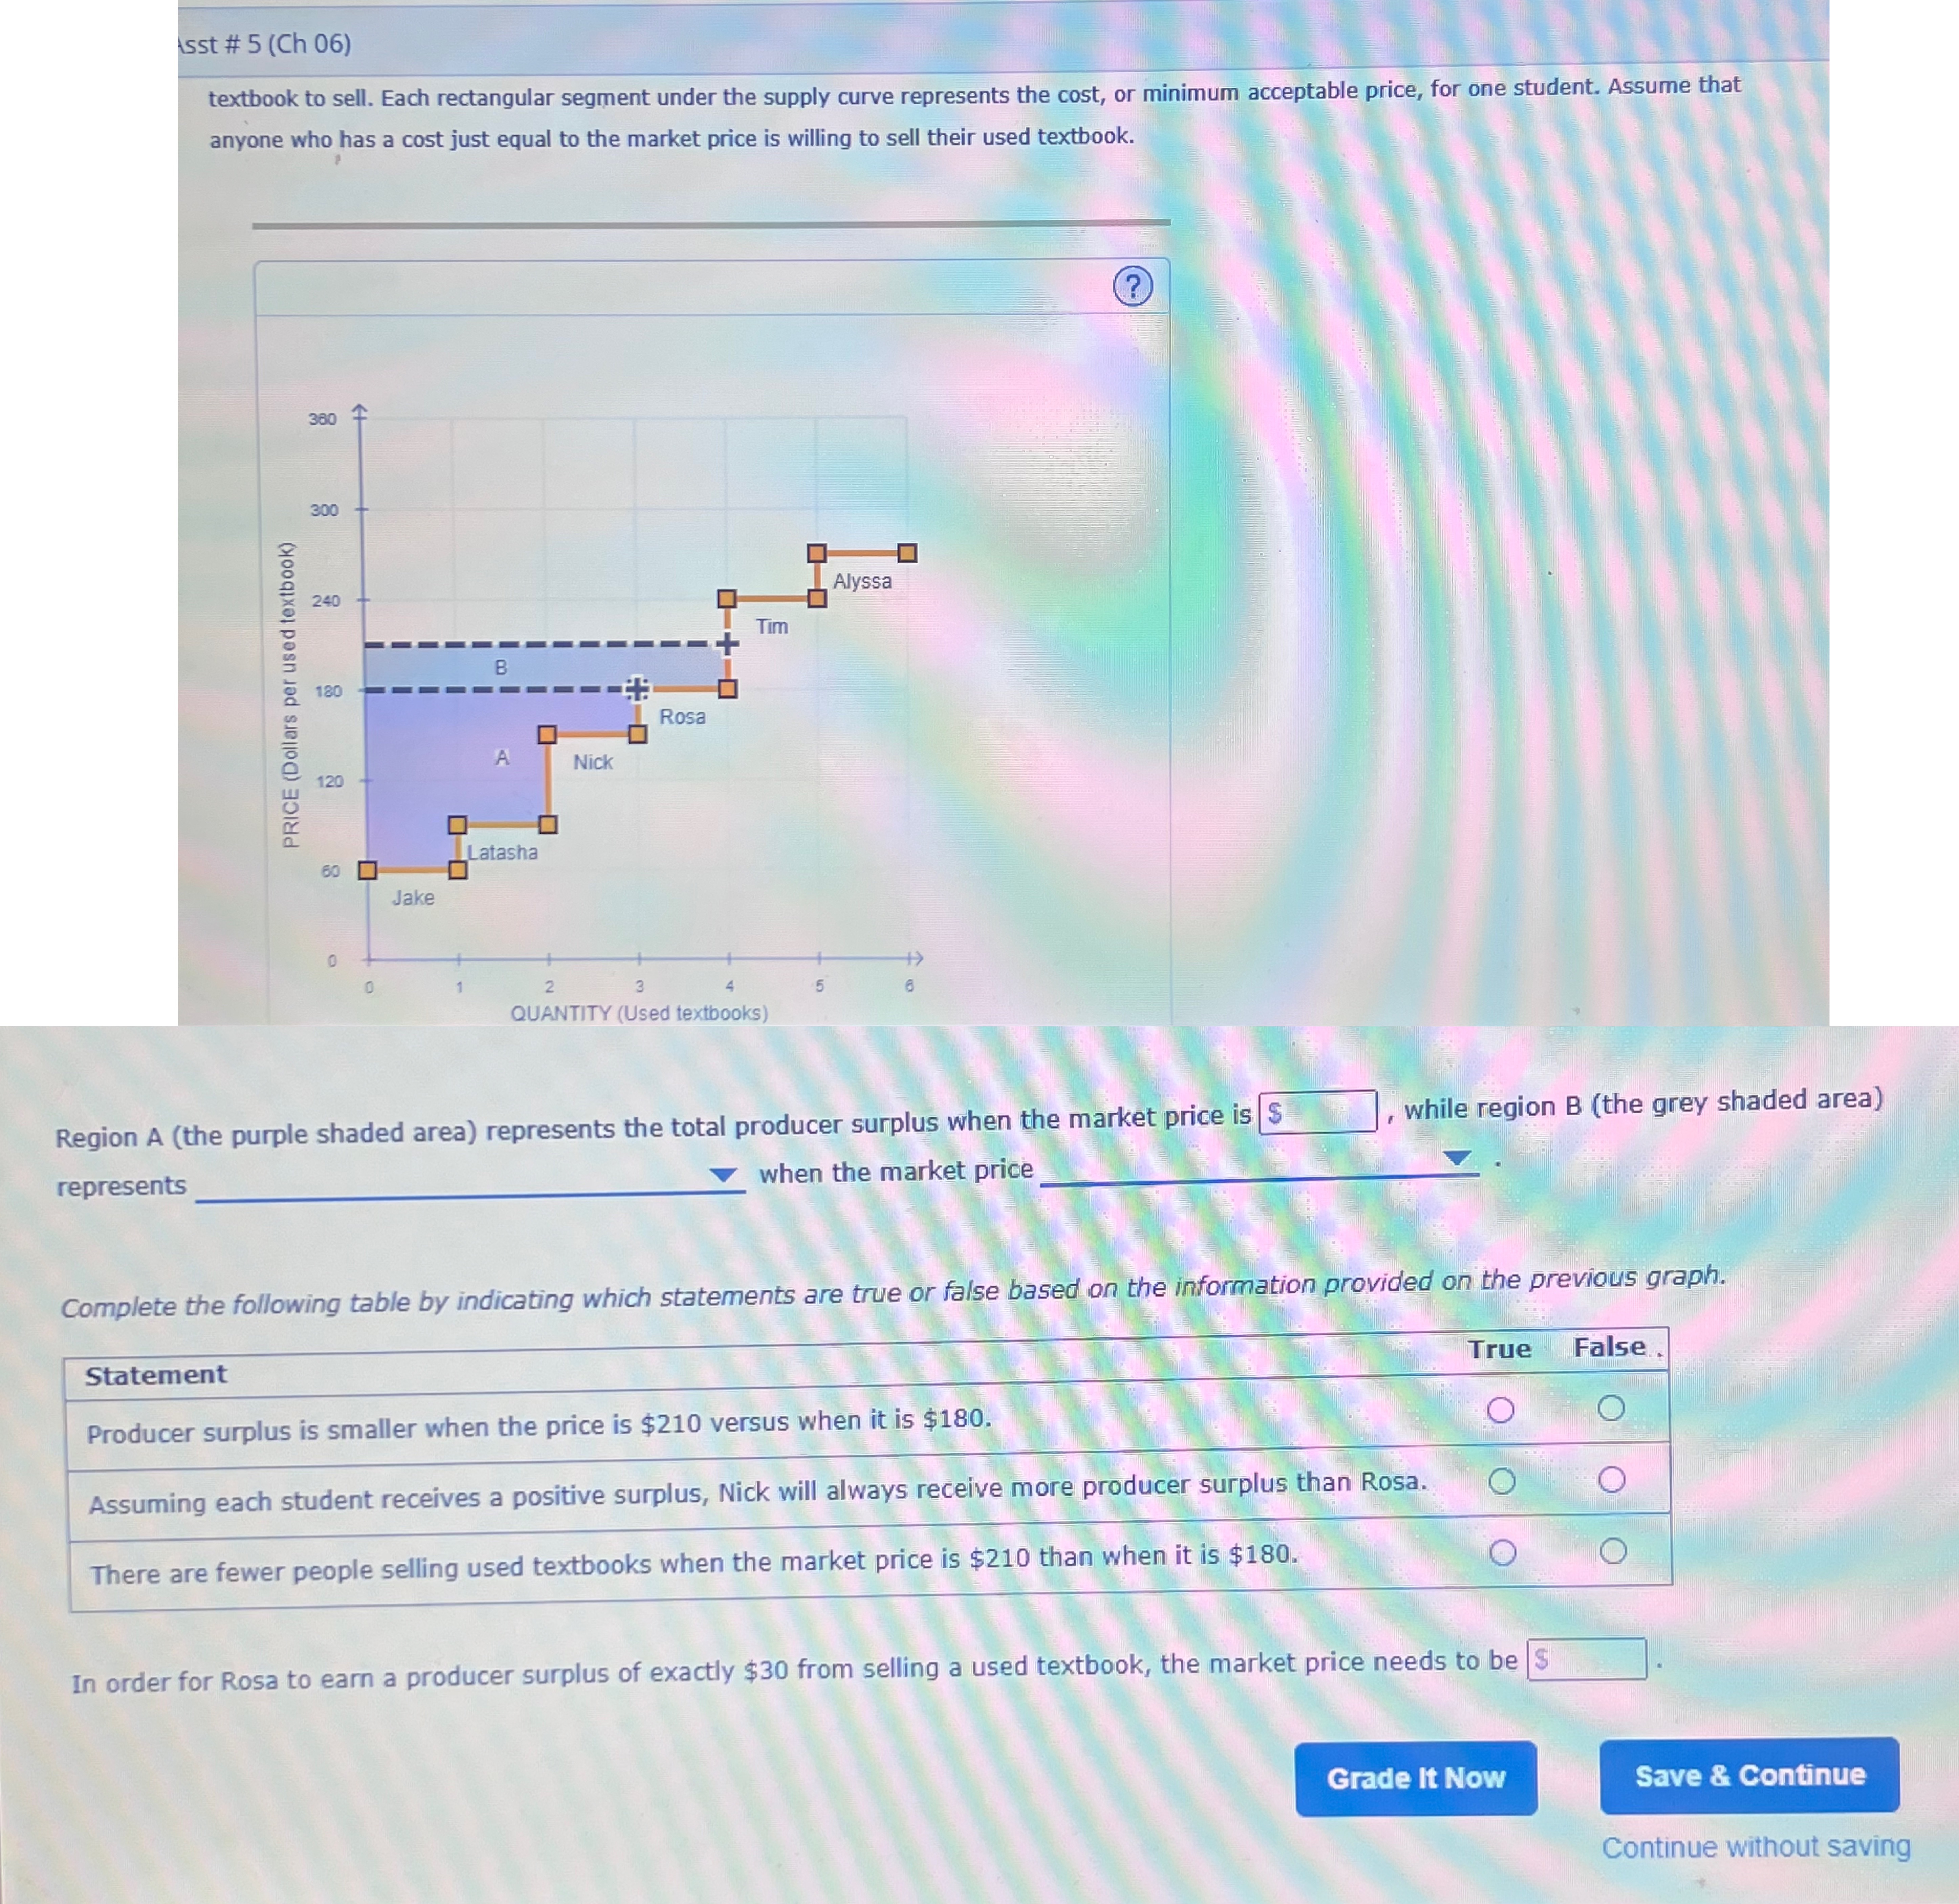
Question: sst # 5 (Ch 06) textbook to sell. Each rectangular segment under the supply curve represents the cost, or minimum acceptable price, for one student.

sst # 5 (Ch 06) textbook to sell. Each
sst # 5 (Ch 06) textbook to sell. Each rectangular segment under the supply curve represents the cost, or minimum acceptable price, for one student. Assume that anyone who has a cost just equal to the market price is willing to sell their used textbook. ? 380 300 Alyssa 240 Tim B PRICE (Dollars per used textbook) 180 Rosa NICK 120 Latasha 60 Jake 5 QUANTITY (Used textbooks) Region A (the purple shaded area) represents the total producer surplus when the market price is $ , while region B (the grey shaded area) represents when the market price Complete the following table by indicating which statements are true or false based on the information provided on the previous graph. Statement True False Producer surplus is smaller when the price is $210 versus when it is $180. O O Assuming each student receives a positive surplus, Nick will always receive more producer surplus than Rosa. O O There are fewer people selling used textbooks when the market price is $210 than when it is $180. O In order for Rosa to earn a producer surplus of exactly $30 from selling a used textbook, the market price needs to be S Grade It Now Save & Continue Continue without saving

Step by Step Solution

There are 3 Steps involved in it

1 Expert Approved Answer
Step: 1 Unlock blur-text-image
Question Has Been Solved by an Expert!

Get step-by-step solutions from verified subject matter experts

Step: 2 Unlock
Step: 3 Unlock

Students Have Also Explored These Related Finance Questions!