

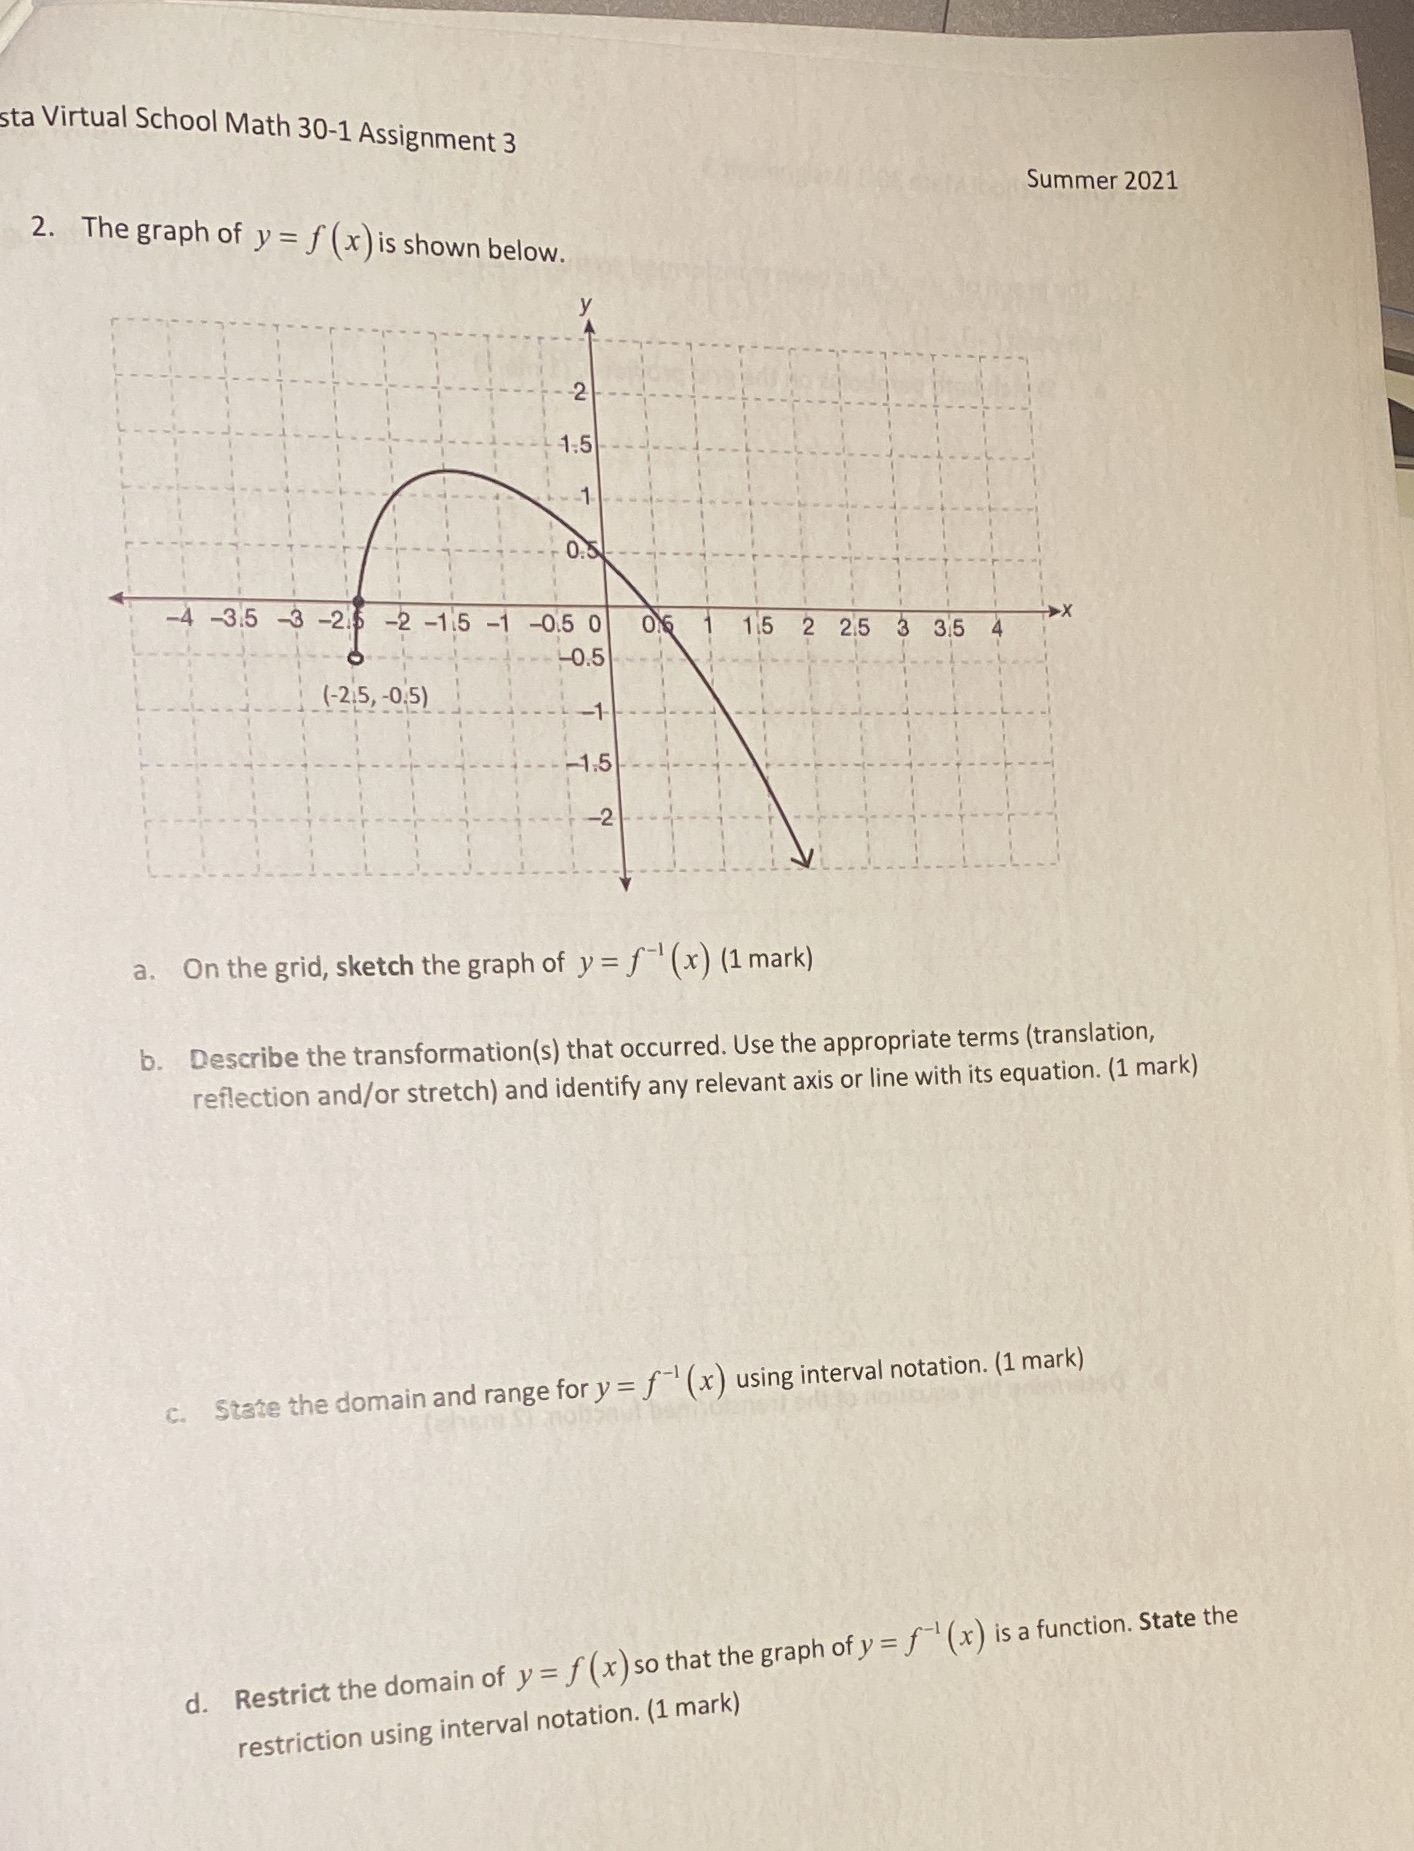
Question: sta Virtual School Math 30-1 Assignment 3 Summer 2021 2. The graph of y = f (x) is shown below. -2 1:5 -4 -3.5 -3
Step by Step Solution
There are 3 Steps involved in it
1 Expert Approved Answer
Step: 1 Unlock

Question Has Been Solved by an Expert!
Get step-by-step solutions from verified subject matter experts
Step: 2 Unlock
Step: 3 Unlock