

Question: Start a new script as above for this question. As above, your complete script must be well documented and your plots must be clear
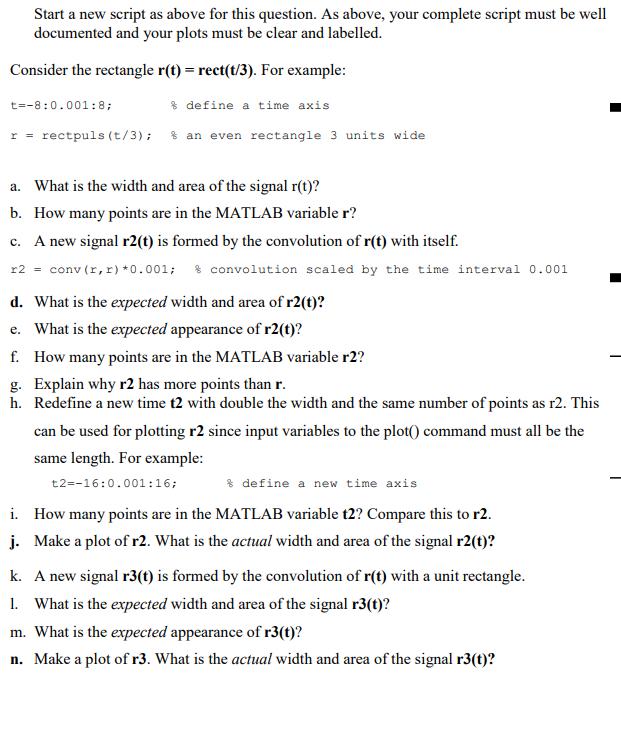
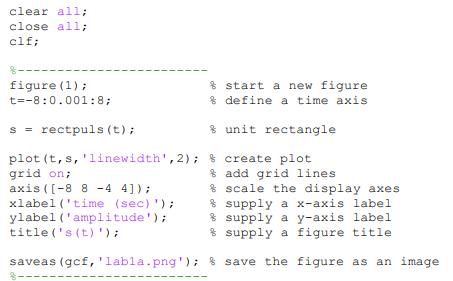
Start a new script as above for this question. As above, your complete script must be well documented and your plots must be clear and labelled. Consider the rectangle r(t) = rect(t/3). For example: define a time axis. t=-8:0.001:8; r = rectpuls (t/3); % an even rectangle 3 units wide a. What is the width and area of the signal r(t)? b. How many points are in the MATLAB variable r? c. A new signal r2(t) is formed by the convolution of r(t) with itself. r2 = conv (r, r) *0.001; %convolution scaled by the time interval 0.001 d. What is the expected width and area of r2(t)? e. What is the expected appearance of r2(t)? f. How many points are in the MATLAB variable r2? g. Explain why r2 has more points than r. h. Redefine a new time t2 with double the width and the same number of points as r2. This can be used for plotting r2 since input variables to the plot() command must all be the same length. For example: t2=-16:0.001:16; * define a new time axis i. How many points are in the MATLAB variable t2? Compare this to r2. j. Make a plot of r2. What is the actual width and area of the signal r2(t)? k. A new signal r3(t) is formed by the convolution of r(t) with a unit rectangle. 1. What is the expected width and area of the signal r3(t)? m. What is the expected appearance of r3(t)? n. Make a plot of r3. What is the actual width and area of the signal r3(t)? clear all; close all; clf; 8 start a new figure define a time axis s rectpuls (t); 8 unit rectangle plot (t, s, 'linewidth', 2); & create plot grid on; axis ([-8 8 -4 4]); xlabel('time (sec)'); ylabel('amplitude'); title ('s (t) '); figure (1); t=-8:0.001:8; add grid lines scale the display axes & supply a x-axis label supply a y-axis label & supply a figure title saveas (gcf, 'labla.png'); & save the figure as an image
Step by Step Solution
3.31 Rating (151 Votes )
There are 3 Steps involved in it

Get step-by-step solutions from verified subject matter experts