

Question: STAT QUESTIONS The scatterplot shows the median annual pay, in dollars per year, for men and women in A various cities. The correlation is 0.90.
STAT QUESTIONS
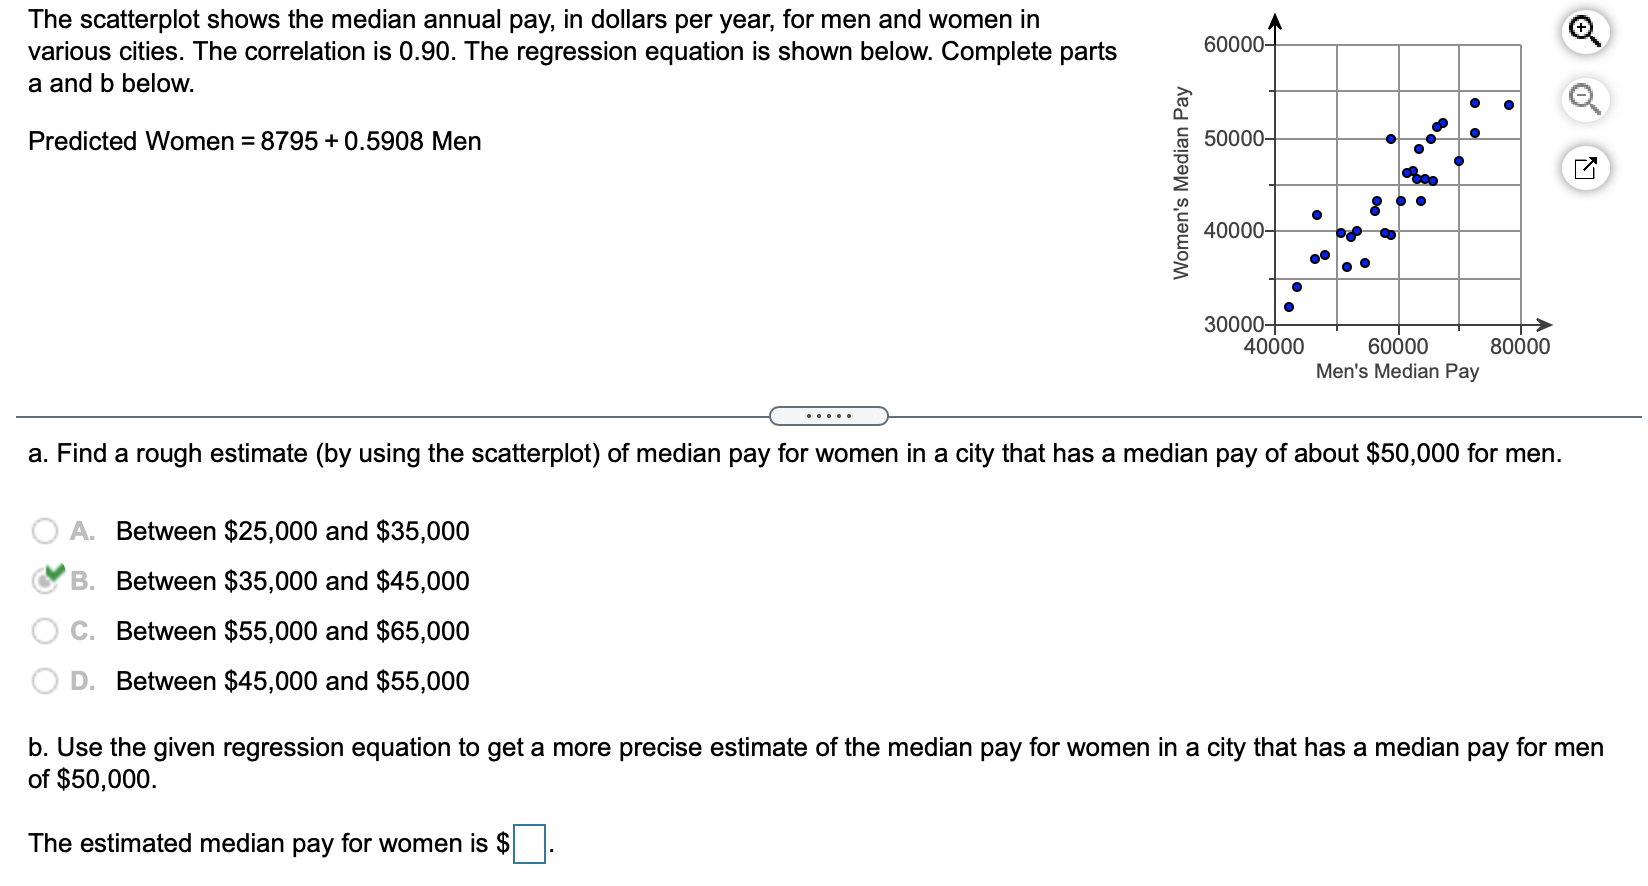
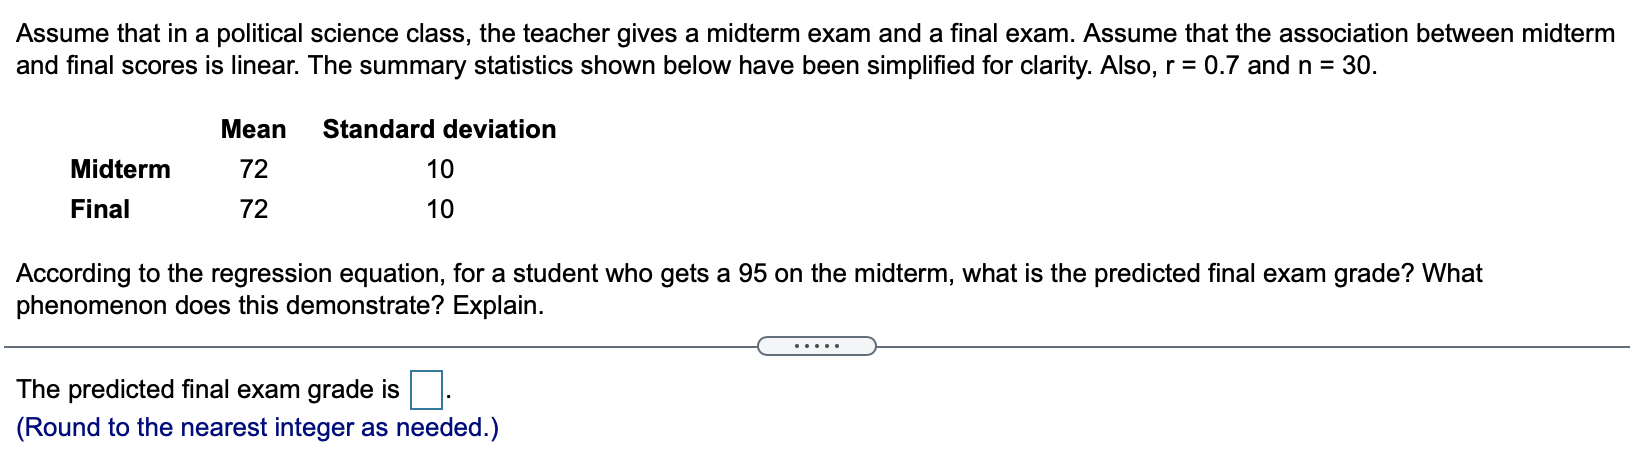
The scatterplot shows the median annual pay, in dollars per year, for men and women in A various cities. The correlation is 0.90. The regression equation is shown below. Complete parts 60000 a and b below. a D. Predicted Women = 8795 + 0.5908 Men '5" 50000 0 0 2 '2 o 3 E 40000 0 .0 . 3 . ' . 30000 40000 60000 80000 Men's Median Pay 3. Find a rough estimate (by using the scatterplot) of median pay for women in a city that has a median pay of about $50,000 for men. A. Between $25,000 and $35,000 3' B. Between $35,000 and $45,000 C. Between $55,000 and $65,000 D. Between $45,000 and $55,000 b. Use the given regression equation to get a more precise estimate of the median pay for women in a city that has a median pay for men of $50,000. The estimated median pay for women is $D. Assume that in a political science class, the teacher gives a midterm exam and a final exam. Assume that the association between midterm and final scores is linear. The summary statistics shown below have been simplified for clarity. Also, r = 0.7 and n = 30. Mean Standard deviation Midterm 72 10 Final 72 10 According to the regression equation, for a student who gets a 95 on the midterm, what is the predicted final exam grade? What phenomenon does this demonstrate? Explain. . . . . . The predicted final exam grade is (Round to the nearest integer as needed.)
Step by Step Solution
There are 3 Steps involved in it

Get step-by-step solutions from verified subject matter experts