

Question: Statistics Question 4 The correct size of a certain object is 21.21 millimeters. Based on that, the data can be summarized into the following table
Statistics

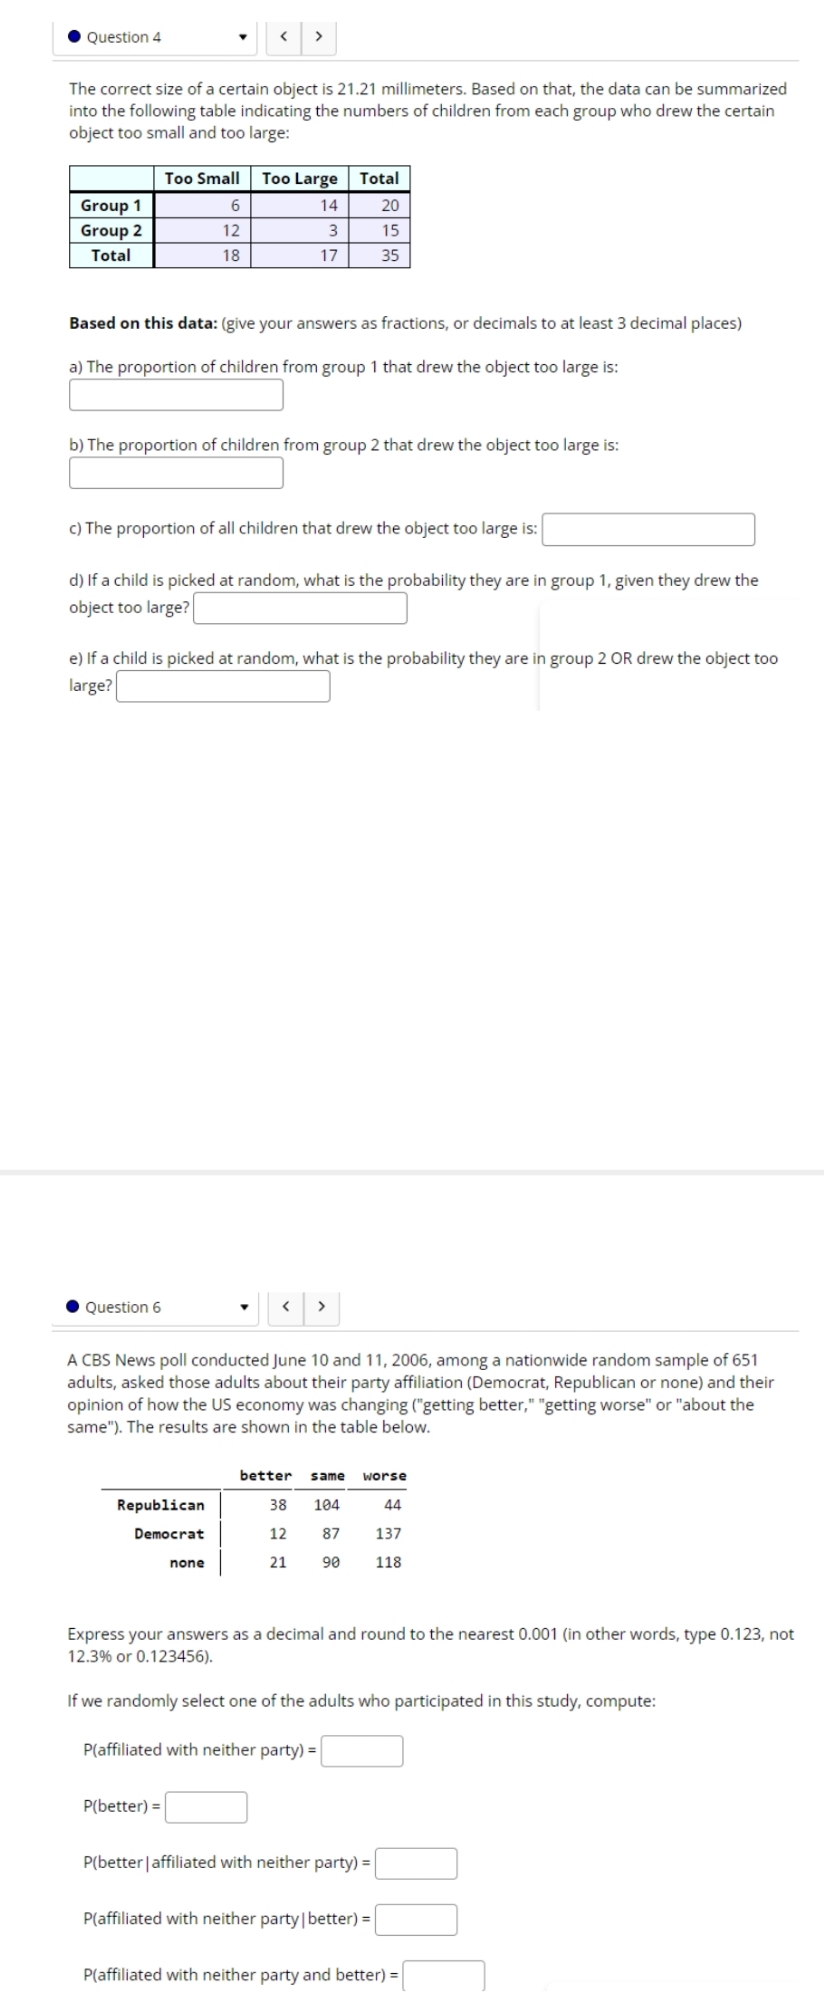
Question 4 The correct size of a certain object is 21.21 millimeters. Based on that, the data can be summarized into the following table indicating the numbers of children from each group who drew the certain object too small and too large: Too Small Too Large Total Group 1 6 14 20 Group 2 12 3 Total 18 17 35 Based on this data: (give your answers as fractions, or decimals to at least 3 decimal places) ) The proportion of children from group 1 that drew the object too large is: b) The proportion of children from group 2 that drew the object too large is: c) The proportion of all children that drew the object too large is: d) If a child is picked at random, what is the probability they are in group 1, given they drew the object too large? e) If a child is picked at random, what is the probability they are in group 2 OR drew the object too large? . Question 6 A CBS News poll conducted June 10 and 11, 2006, among a nationwide random sample of 651 adults, asked those adults about their party affiliation (Democrat, Republican or none) and their opinion of how the US economy was changing ("getting better," "getting worse" or "about the same"). The results are shown in the table below. better same worse Republican 38 104 44 Democrat 12 87 137 none 21 90 118 Express your answers as a decimal and round to the nearest 0.001 (in other words, type 0.123, not 12.3% or 0.123456). If we randomly select one of the adults who participated in this study, compute: P(affiliated with neither party) = P(better) = P(better | affiliated with neither party) = P(affiliated with neither party | better) = P(affiliated with neither party and better) =
Step by Step Solution
There are 3 Steps involved in it

Get step-by-step solutions from verified subject matter experts