

Question: statistics 2. The correct size of a certain object is 21.21 millimeters. Based on that, the data can be summarized into the following table indicating
statistics
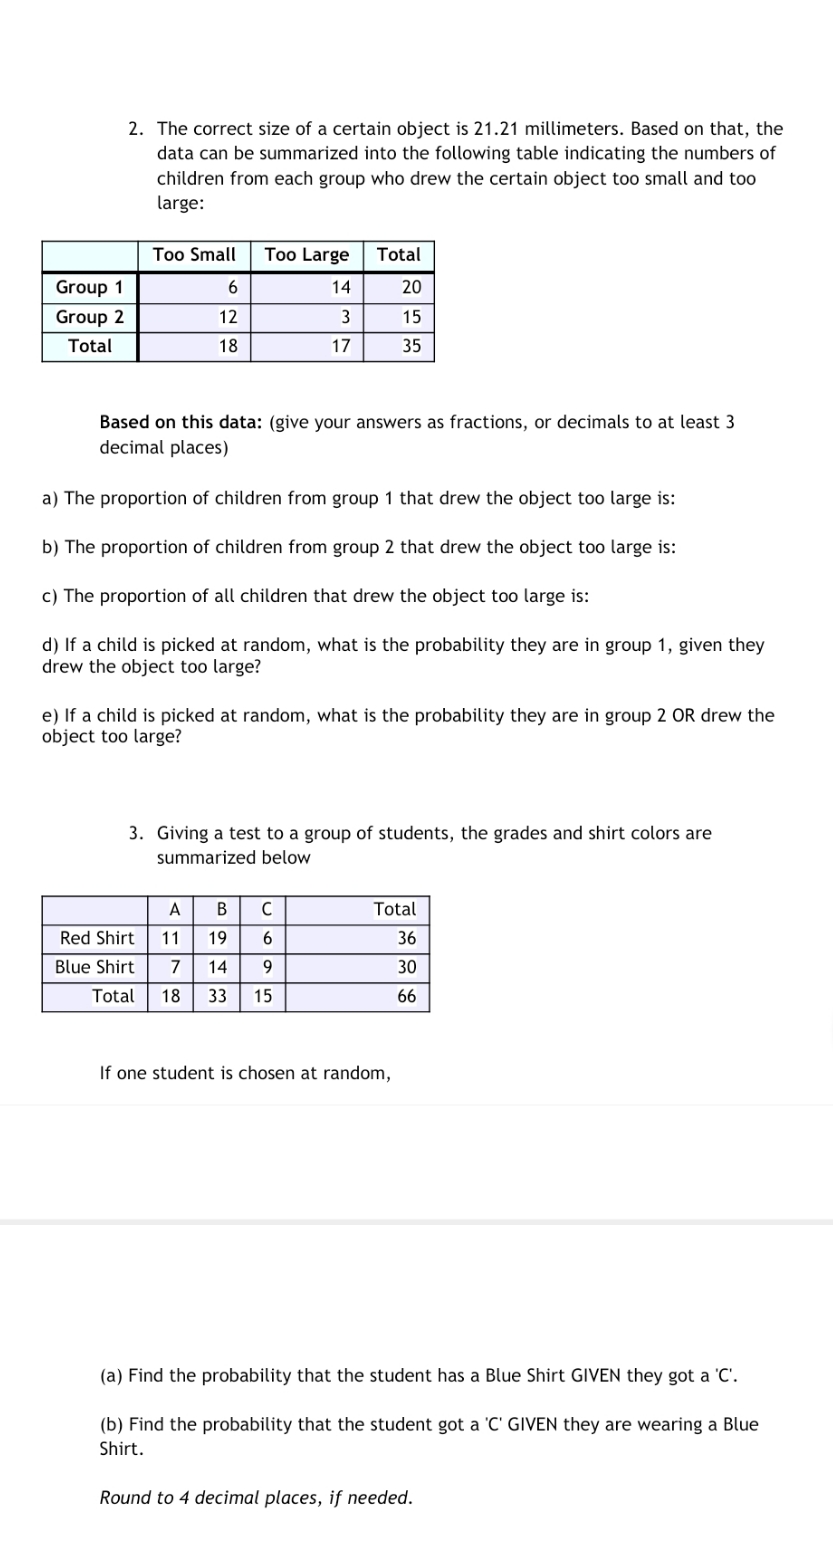
2. The correct size of a certain object is 21.21 millimeters. Based on that, the data can be summarized into the following table indicating the numbers of children from each group who drew the certain object too small and too large: Too Small Too Large Total Group 1 6 14 20 Group 2 12 3 15 Total 18 17 35 Based on this data: (give your answers as fractions, or decimals to at least 3 decimal places) a) The proportion of children from group 1 that drew the object too large is: b) The proportion of children from group 2 that drew the object too large is: c) The proportion of all children that drew the object too large is: d) If a child is picked at random, what is the probability they are in group 1, given they drew the object too large? e) If a child is picked at random, what is the probability they are in group 2 OR drew the object too large? 3. Giving a test to a group of students, the grades and shirt colors are summarized below A B C Total Red Shirt 11 19 6 36 Blue Shirt 7 14 9 30 Total 18 33 15 66 If one student is chosen at random, (a) Find the probability that the student has a Blue Shirt GIVEN they got a 'C'. (b) Find the probability that the student got a 'C' GIVEN they are wearing a Blue Shirt. Round to 4 decimal places, if needed
Step by Step Solution
There are 3 Steps involved in it

Get step-by-step solutions from verified subject matter experts