

Question: STATISTICS QUESTIONS !! Only need a simple letter / number answer, NO EXPLANATION REQUIRED ! Will give a thumbs up for a quick and simple
STATISTICS QUESTIONS!! Only need a simple letter / number answer, NO EXPLANATION REQUIRED!
Will give a thumbs up for a quick and simple answer, no need to go into detail. Please have the answer be legible and clear!

Thank you! Will give thumbs up for a fast and understandable answer! Again, NO EXPLANATION IS REQUIRED just a simple answer!
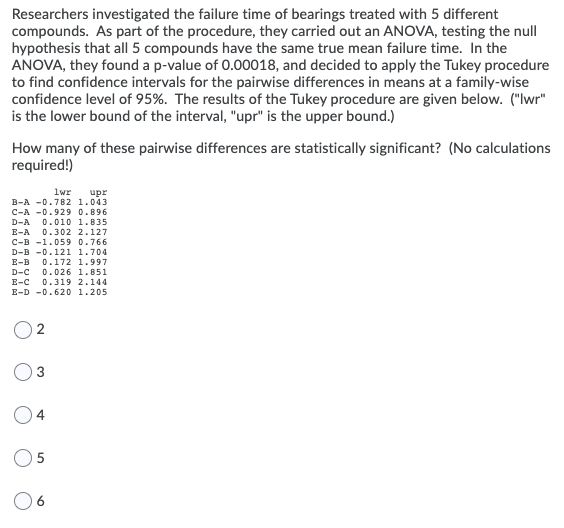
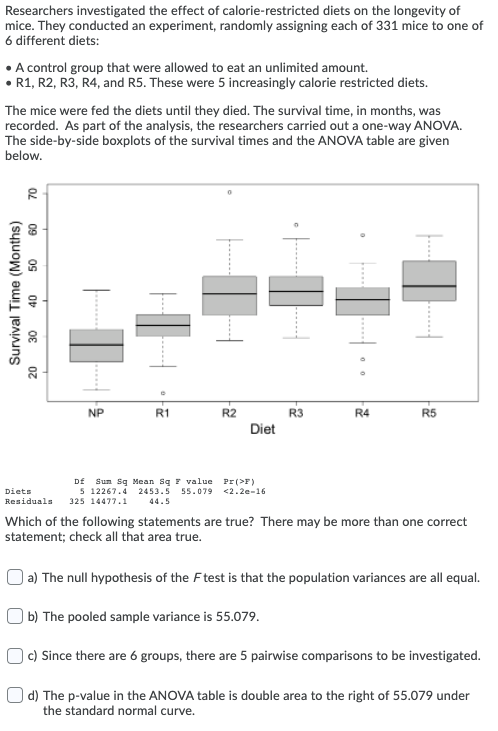
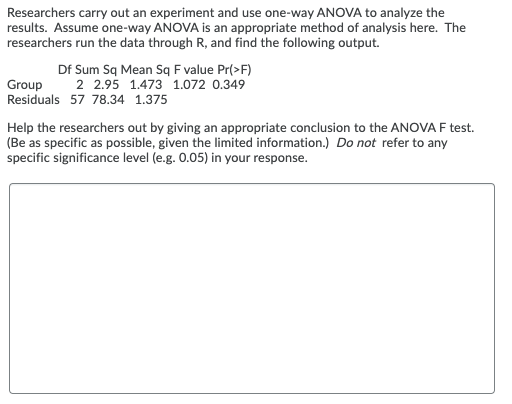
Which of the following statements about one-way ANOVA (Analysis of Variance) are true? There may be more than one correct statement; check all that are true. a) If the sample means are all equal, the p-value will be very small. | b) One assumption of one-way ANOVA is that the observations in each group have a binomial distribution. c) If the null hypothesis and the assumptions of one-way ANOVA are true, the p- value will have an F distribution with the appropriate degrees of freedom. d) One-way ANOVA tests the null hypothesis that the population means are all equal. Researchers investigated the failure time of bearings treated with 5 different compounds. As part of the procedure, they carried out an ANOVA, testing the null hypothesis that all 5 compounds have the same true mean failure time. In the ANOVA, they found a p-value of 0.00018, and decided to apply the Tukey procedure to find confidence intervals for the pairwise differences in means at a family-wise confidence level of 95%. The results of the Tukey procedure are given below. ("lwr" is the lower bound of the interval, "upr" is the upper bound.) How many of these pairwise differences are statistically significant? (No calculations required!) up lwr B-A -0.782 1.043 C-A -0.929 0.896 D-A 0.010 1.835 E-A 0.302 2.127 C-B-1.059 0.766 D-B -0.121 1.704 E-B 0.172 1.997 D-C 0.026 1.851 E-C 0.319 2.144 E-D-0.620 1.205 N 3 04 05 Researchers investigated the effect of calorie-restricted diets on the longevity of mice. They conducted an experiment, randomly assigning each of 331 mice to one of 6 different diets: A control group that were allowed to eat an unlimited amount. R1, R2, R3, R4, and R5. These were 5 increasingly calorie restricted diets. The mice were fed the diets until they died. The survival time, in months, was recorded. As part of the analysis, the researchers carried out a one-way ANOVA. The side-by-side boxplots of the survival times and the ANOVA table are given below. 70 60 50 Survival Time (Months) 40 30 20 NP R1 R2 R3 R4 R5 Diet Diets Residuals Df Sum Sg Mean Sg value Pr(>F) 5 12267.4 2453.5 55.079 F) Group 2 2.95 1.473 1.072 0.349 Residuals 57 78.34 1.375 Help the researchers out by giving an appropriate conclusion to the ANOVA F test. (Be as specific as possible, given the limited information.) Do not refer to any specific significance level (e.g. 0.05) in your responseStep by Step Solution
There are 3 Steps involved in it
1 Expert Approved Answer
Step: 1 Unlock

Question Has Been Solved by an Expert!
Get step-by-step solutions from verified subject matter experts
Step: 2 Unlock
Step: 3 Unlock