

Question: statistics The boxplot below shows salaries for Construction workers and Teachers. Construction . l l i i h 20 25 3 0 35 4'0 45

statistics
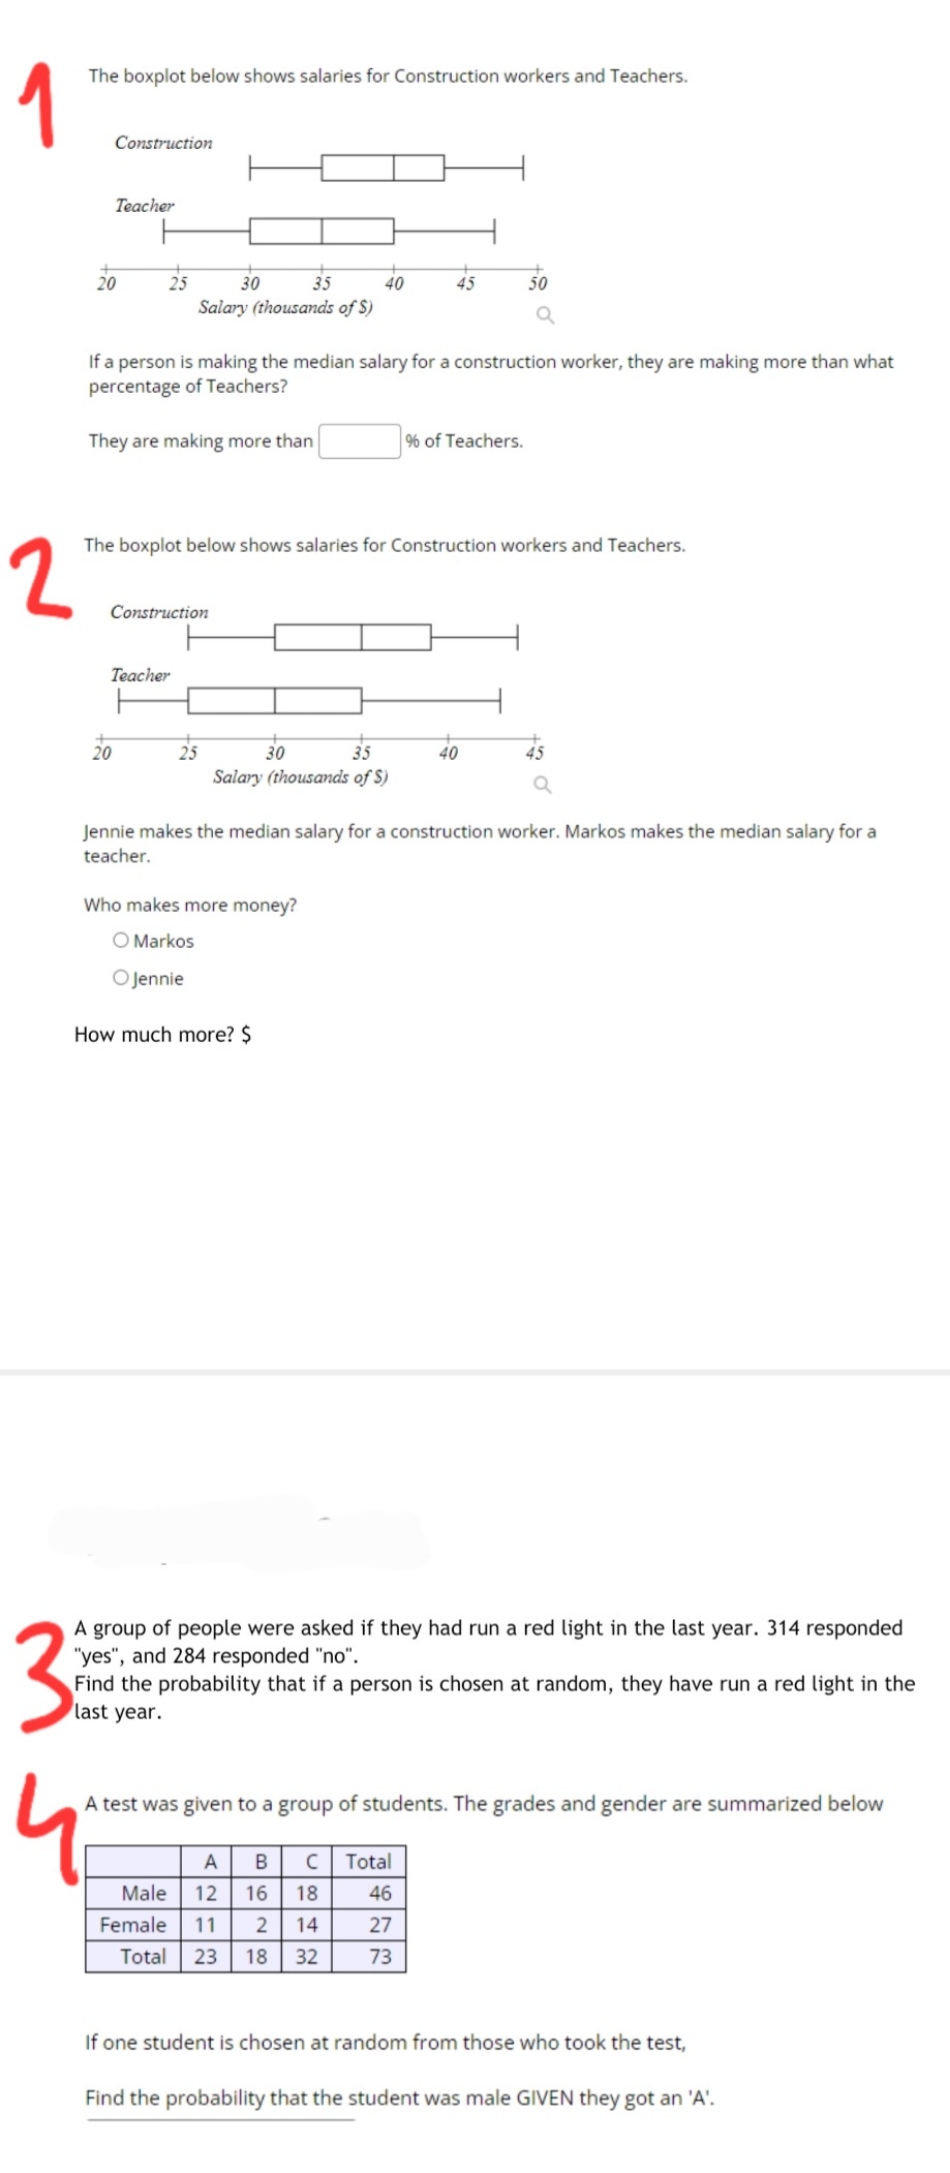
The boxplot below shows salaries for Construction workers and Teachers. Construction . l l i i h 20 25 3 0 35 4'0 45 50 Safely (thousand: ofS} If a person is making the median salary for a construction worker, they are making more than what percentage of Teachers? They are making more than 96 of Teachers. The boxplot below shows salarles for Construction workers and Teachers. Construction ll:|:ll 4- o- i 0 20 25 30 3.5 40 45 Salary (rhouands ofS) J jennie makes the median salary for a construction worker. Markos makes the median salary for a teacher. Who makes more money? 0 Markos Olennie How much more? 5 A group of people were asked if they had run a red light in the last year. 314 responded "yes", and 284 responded "no\". Find the probability that if a person is chosen at random, they have run a red light in the last year. A test was given to a group of students. The grades and gender are summarized below If one student Is chosen at random from those who took the test, Find the probability that the student was male GIVEN they got an 'A
Step by Step Solution
There are 3 Steps involved in it

Get step-by-step solutions from verified subject matter experts