

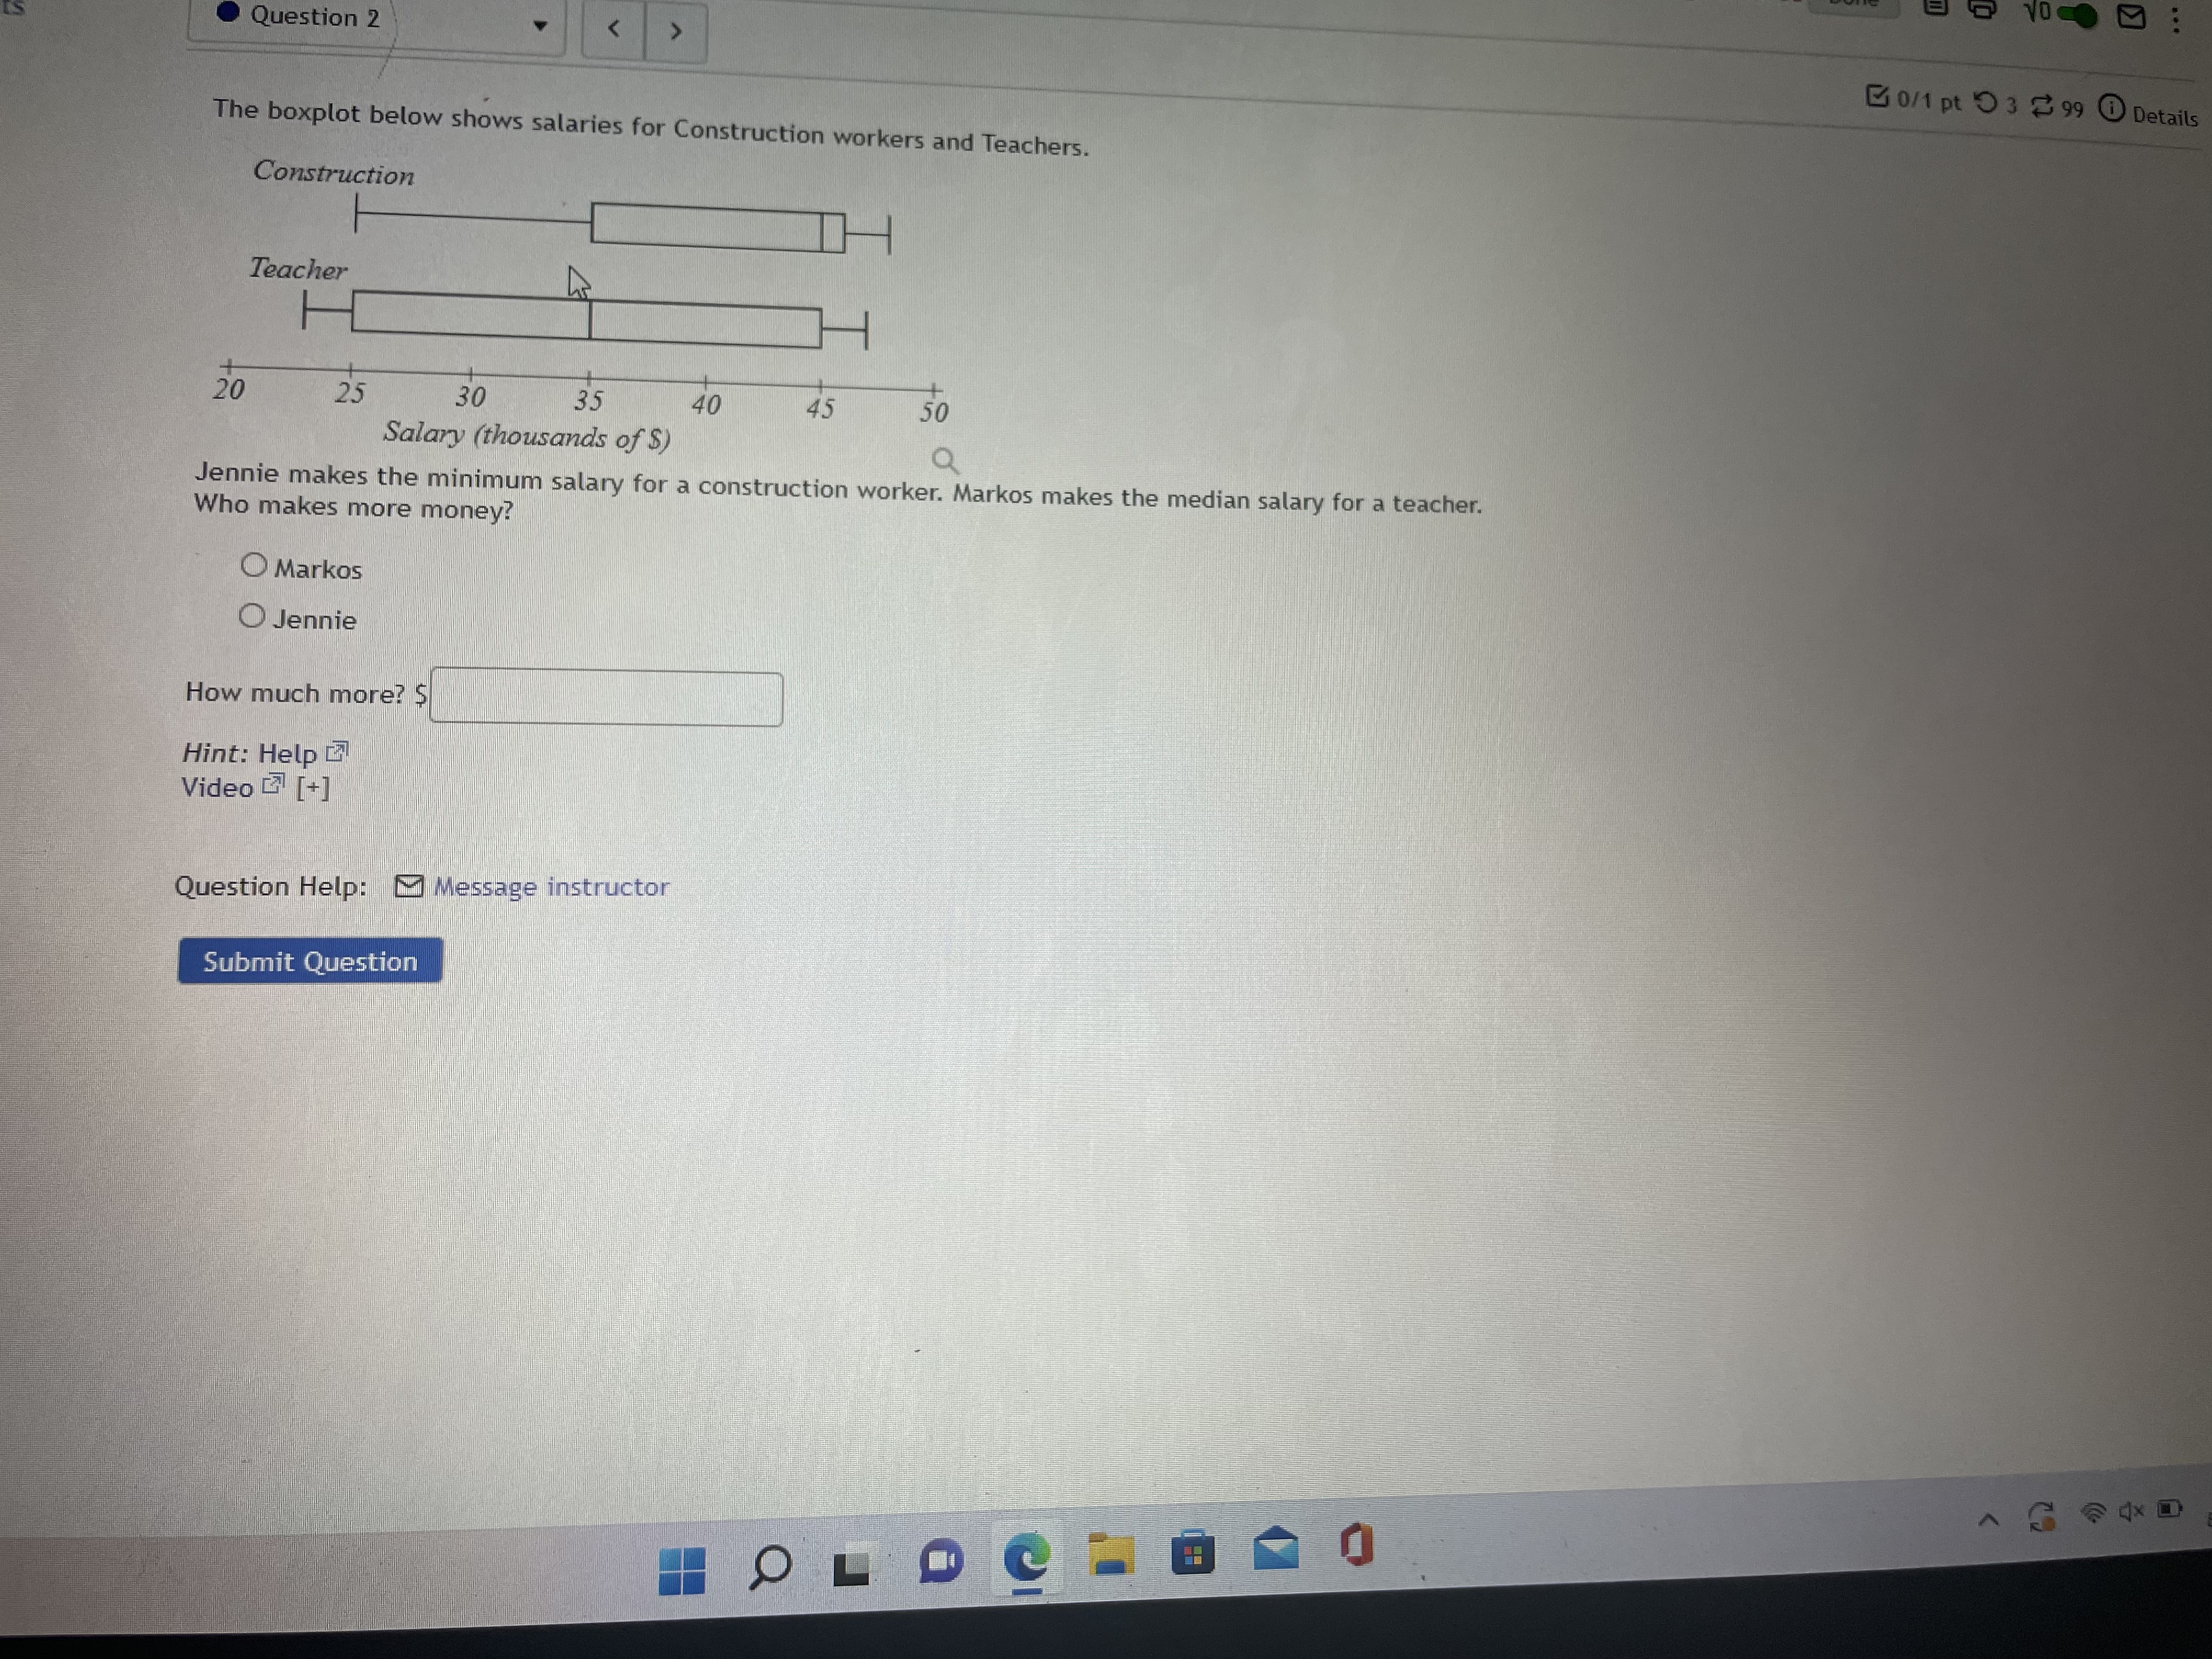
Question: 0 : Question 2 0/1 pt 9 3 99 0 Details The boxplot below shows salaries for Construction workers and Teachers. Construction Teacher H 20
![How much more? $ Hint: Help Video ) [+] Question Help: Message](https://s3.amazonaws.com/si.experts.images/answers/2024/06/667f8cac3a225_116667f8cac0ba57.jpg)
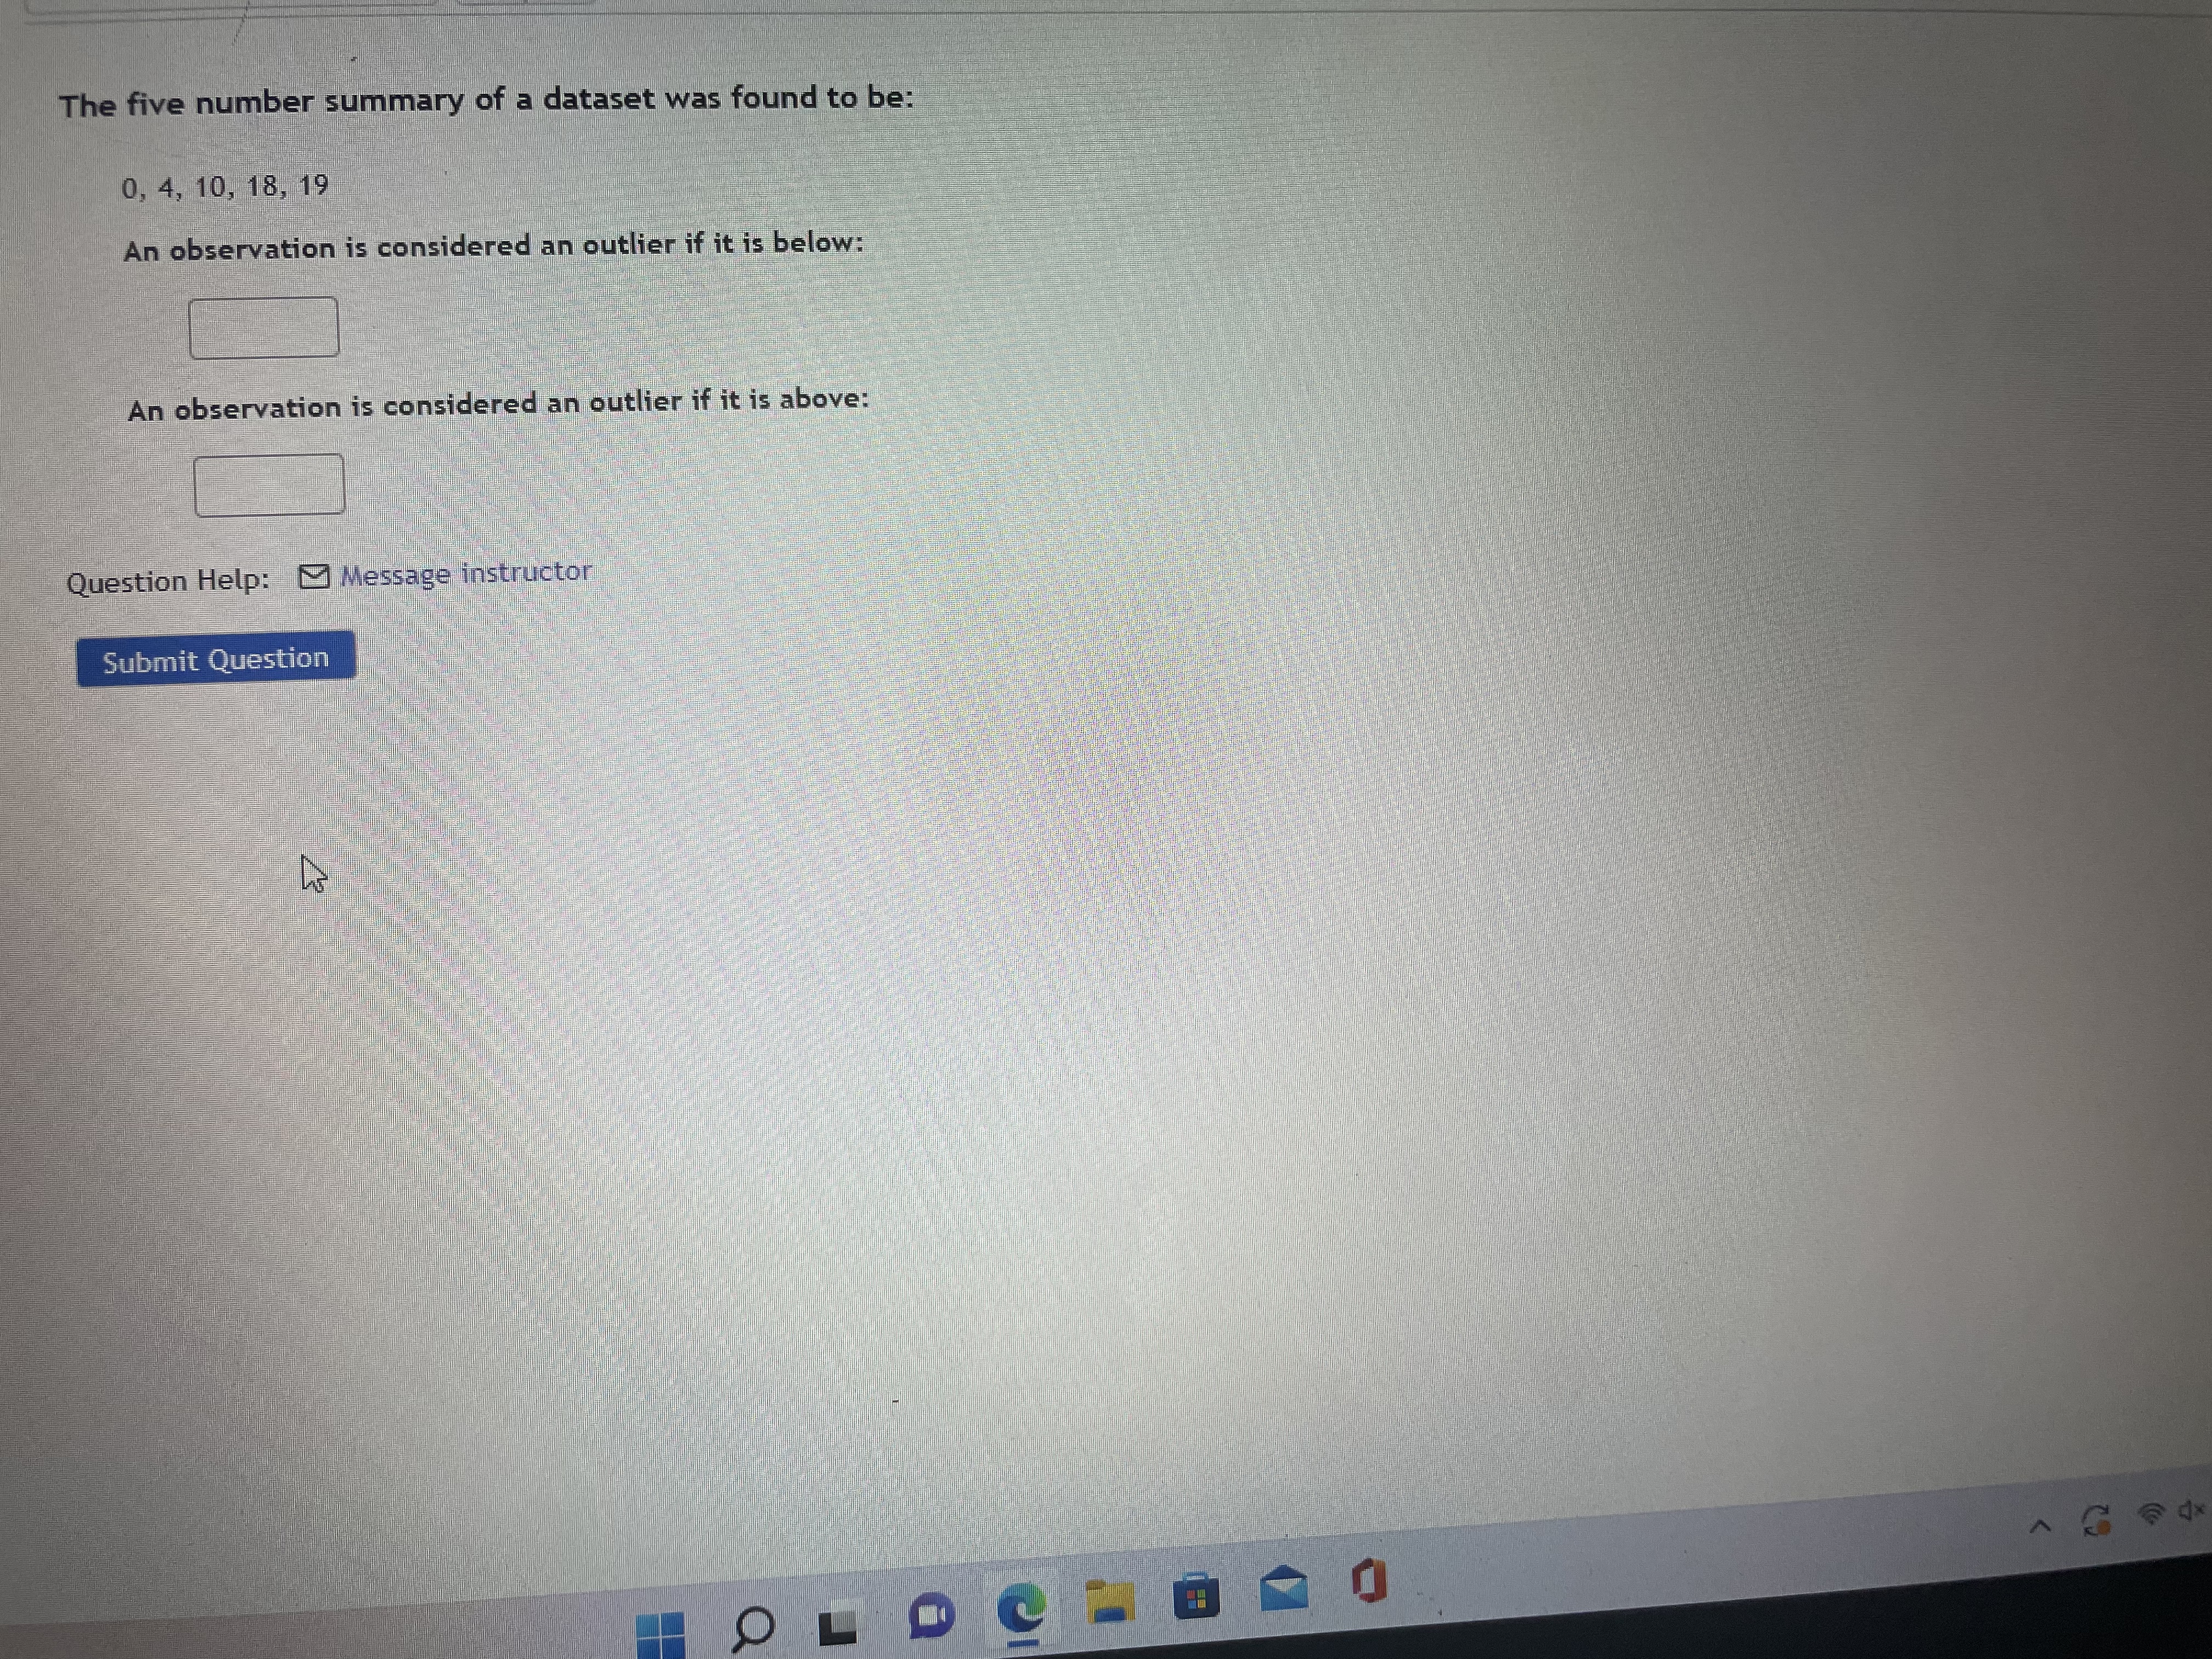
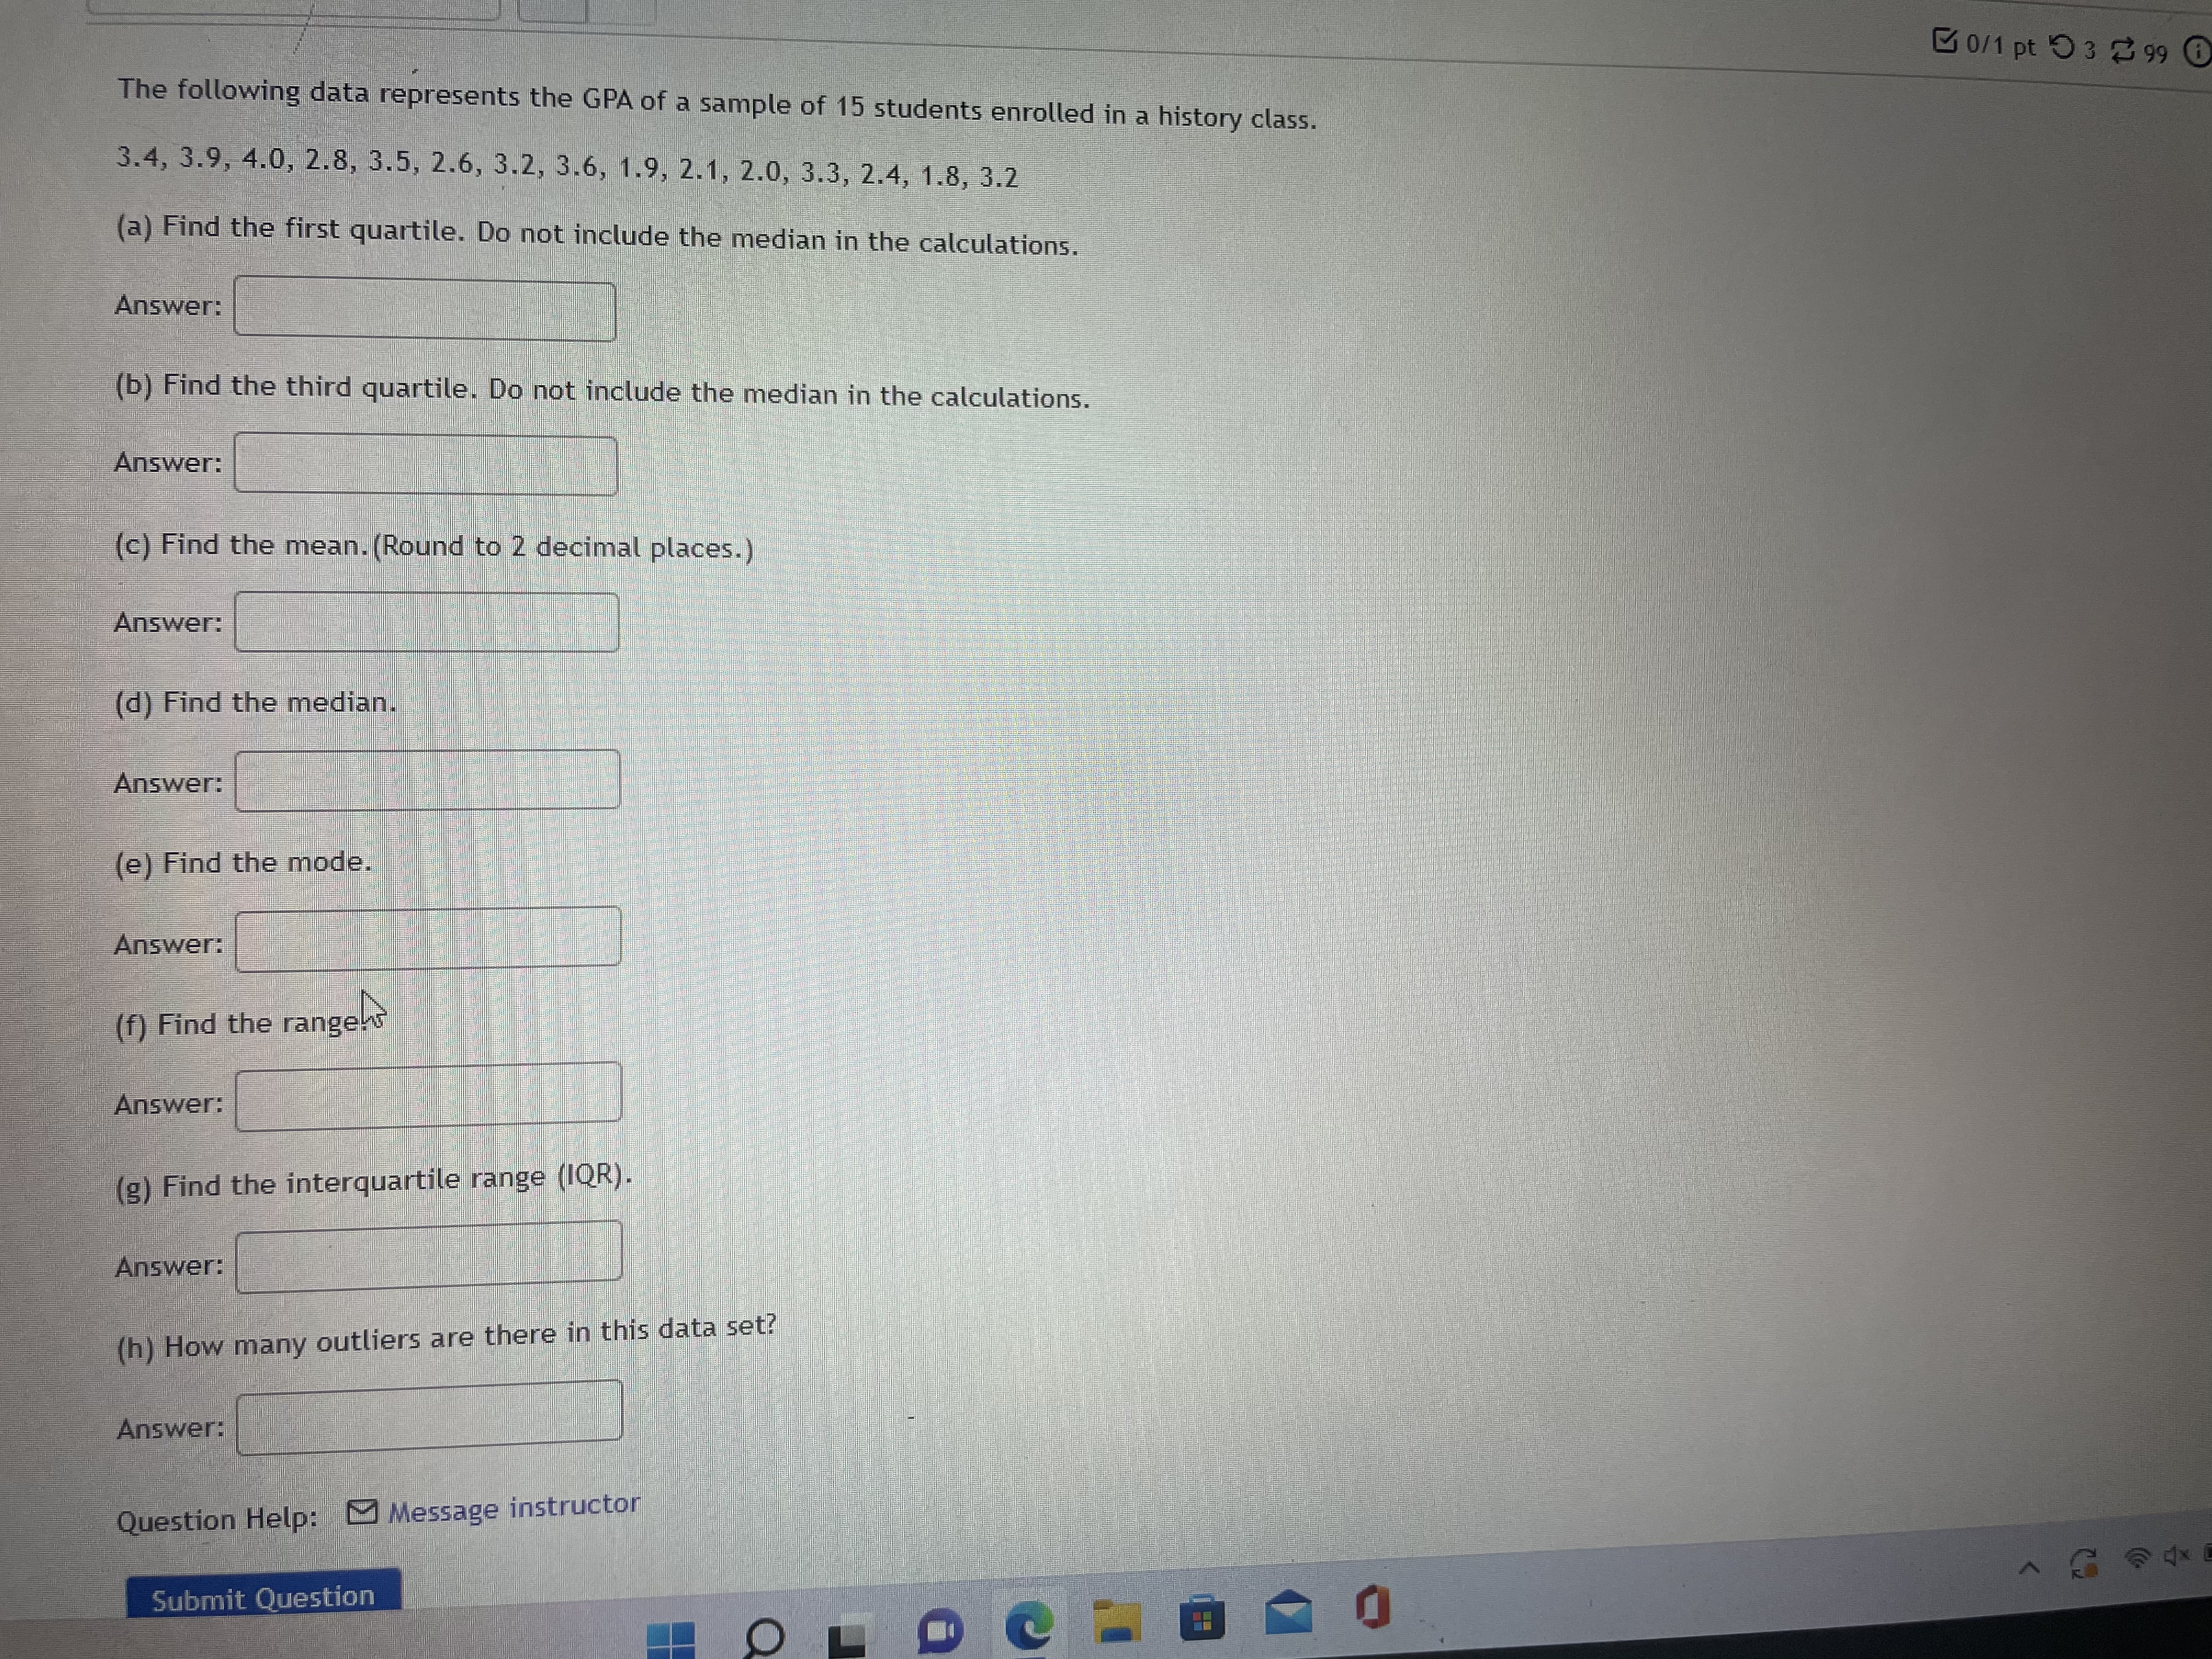
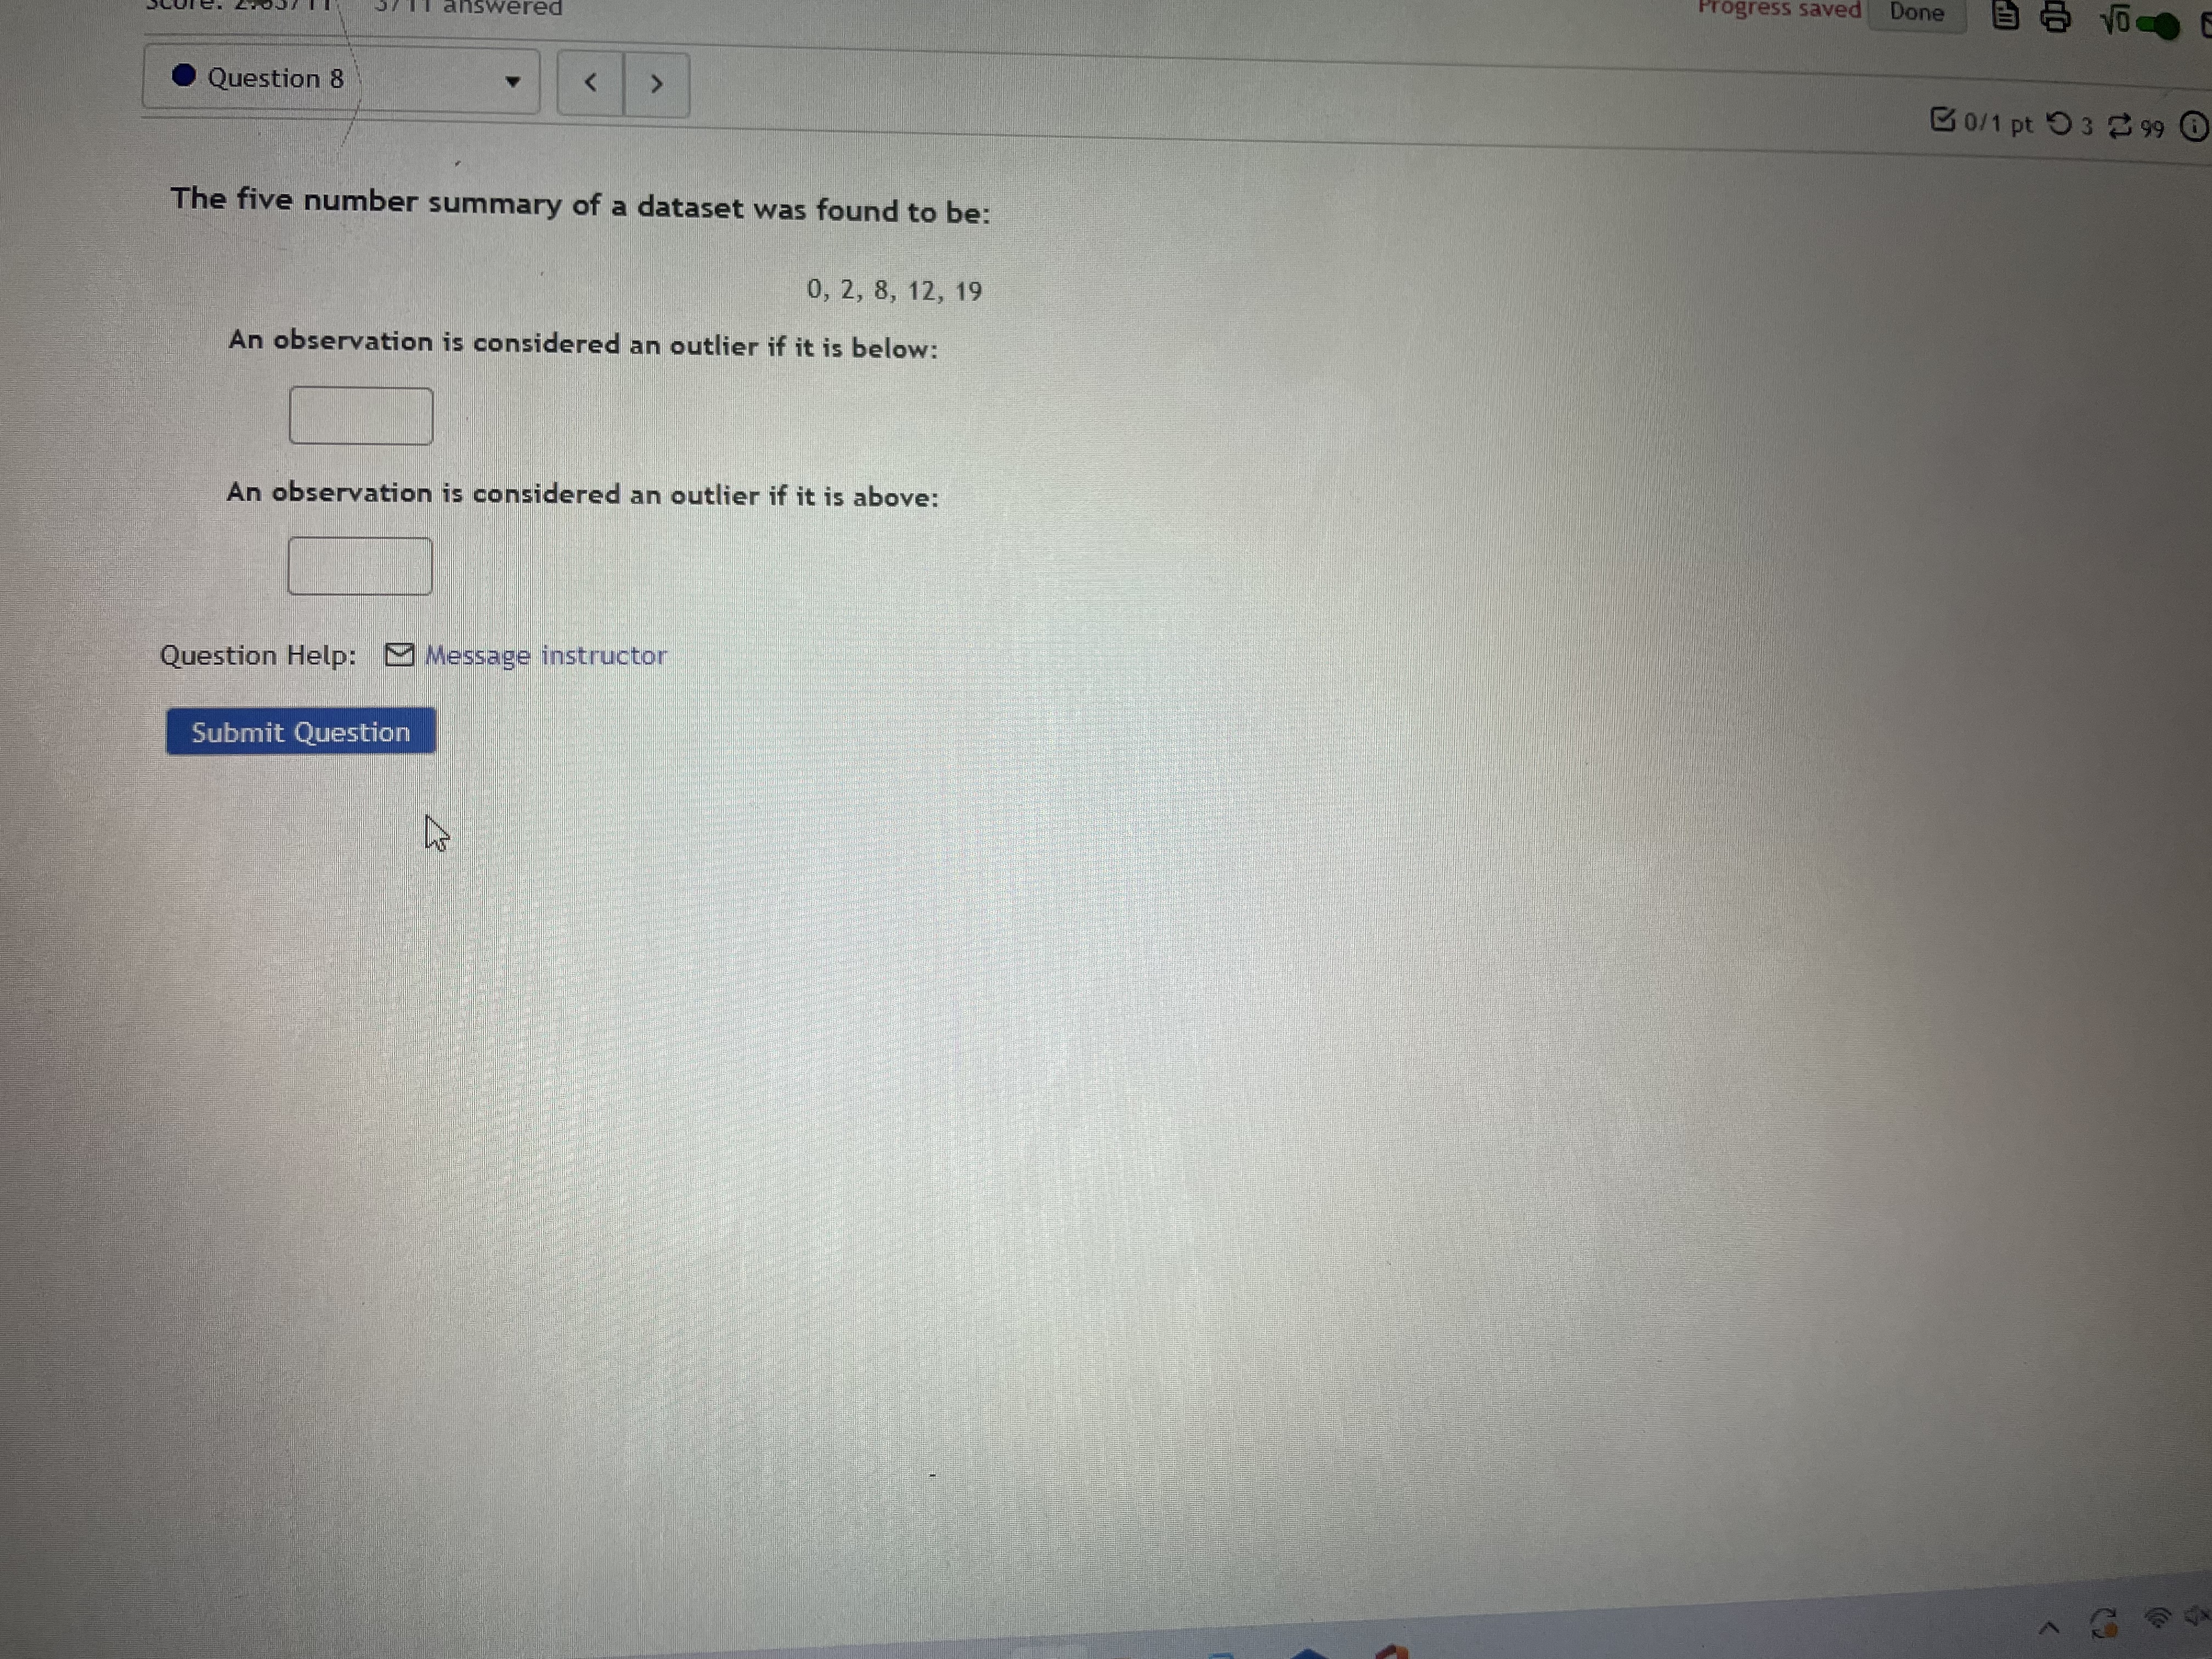
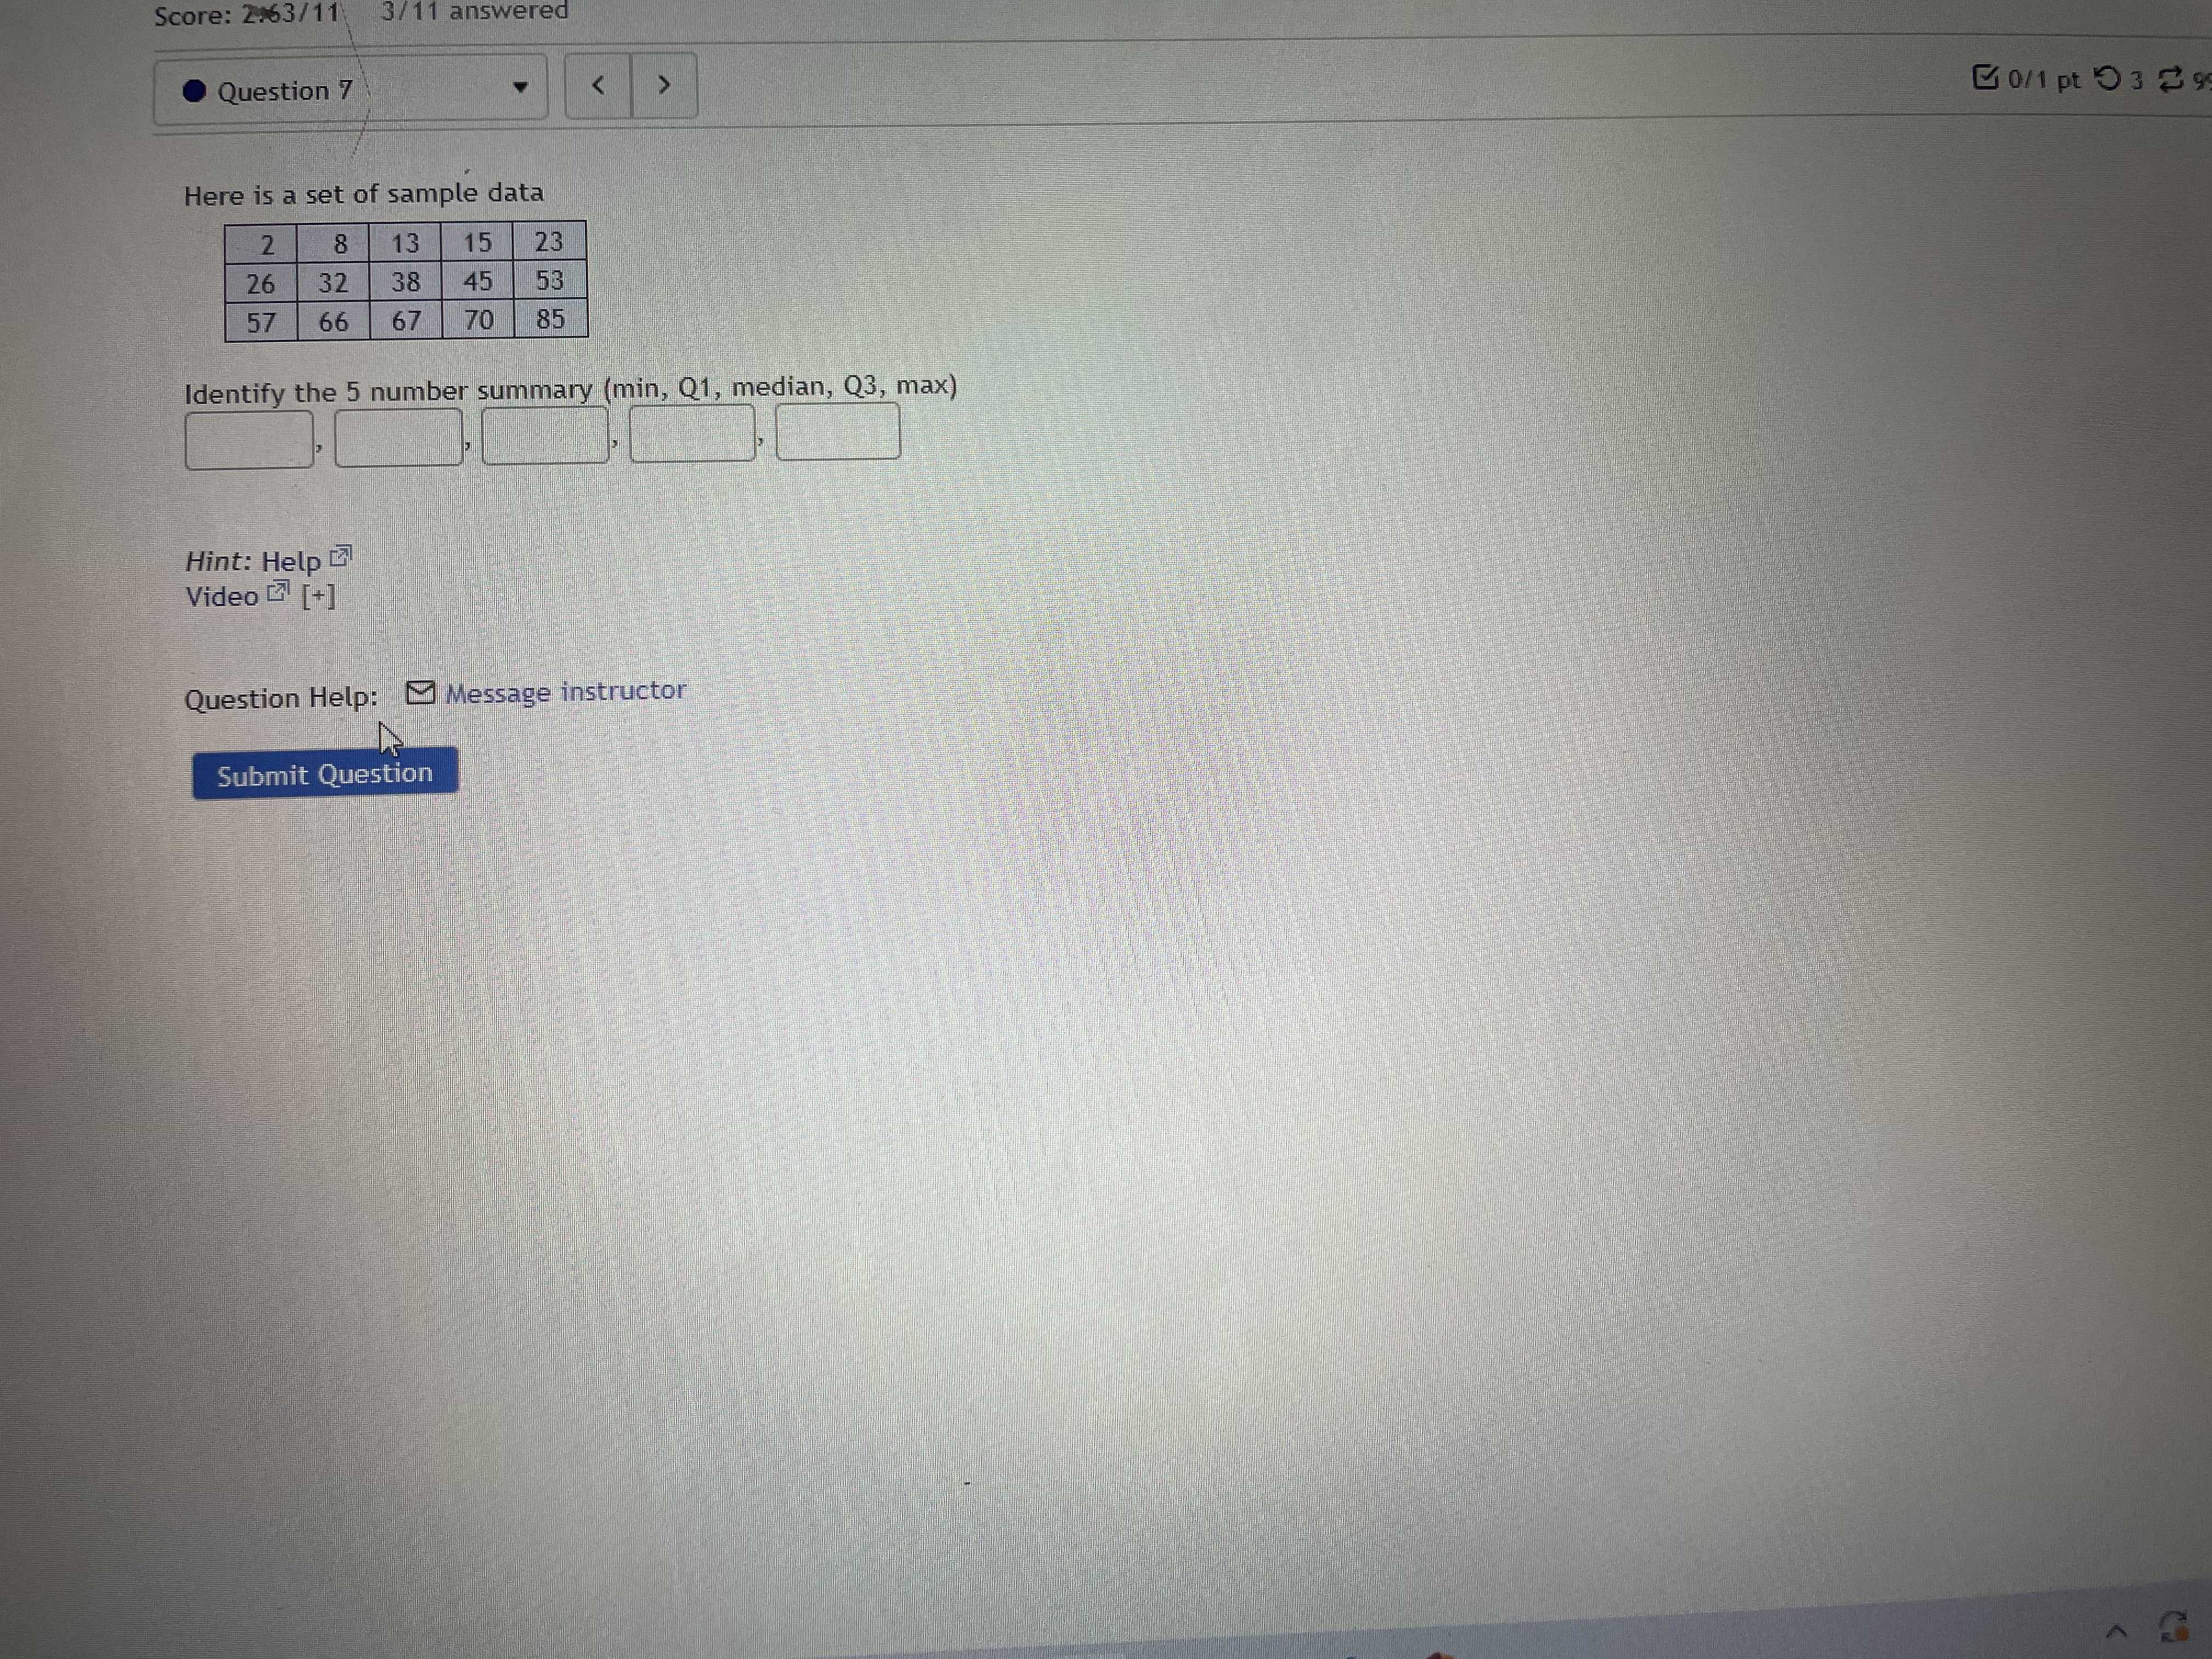
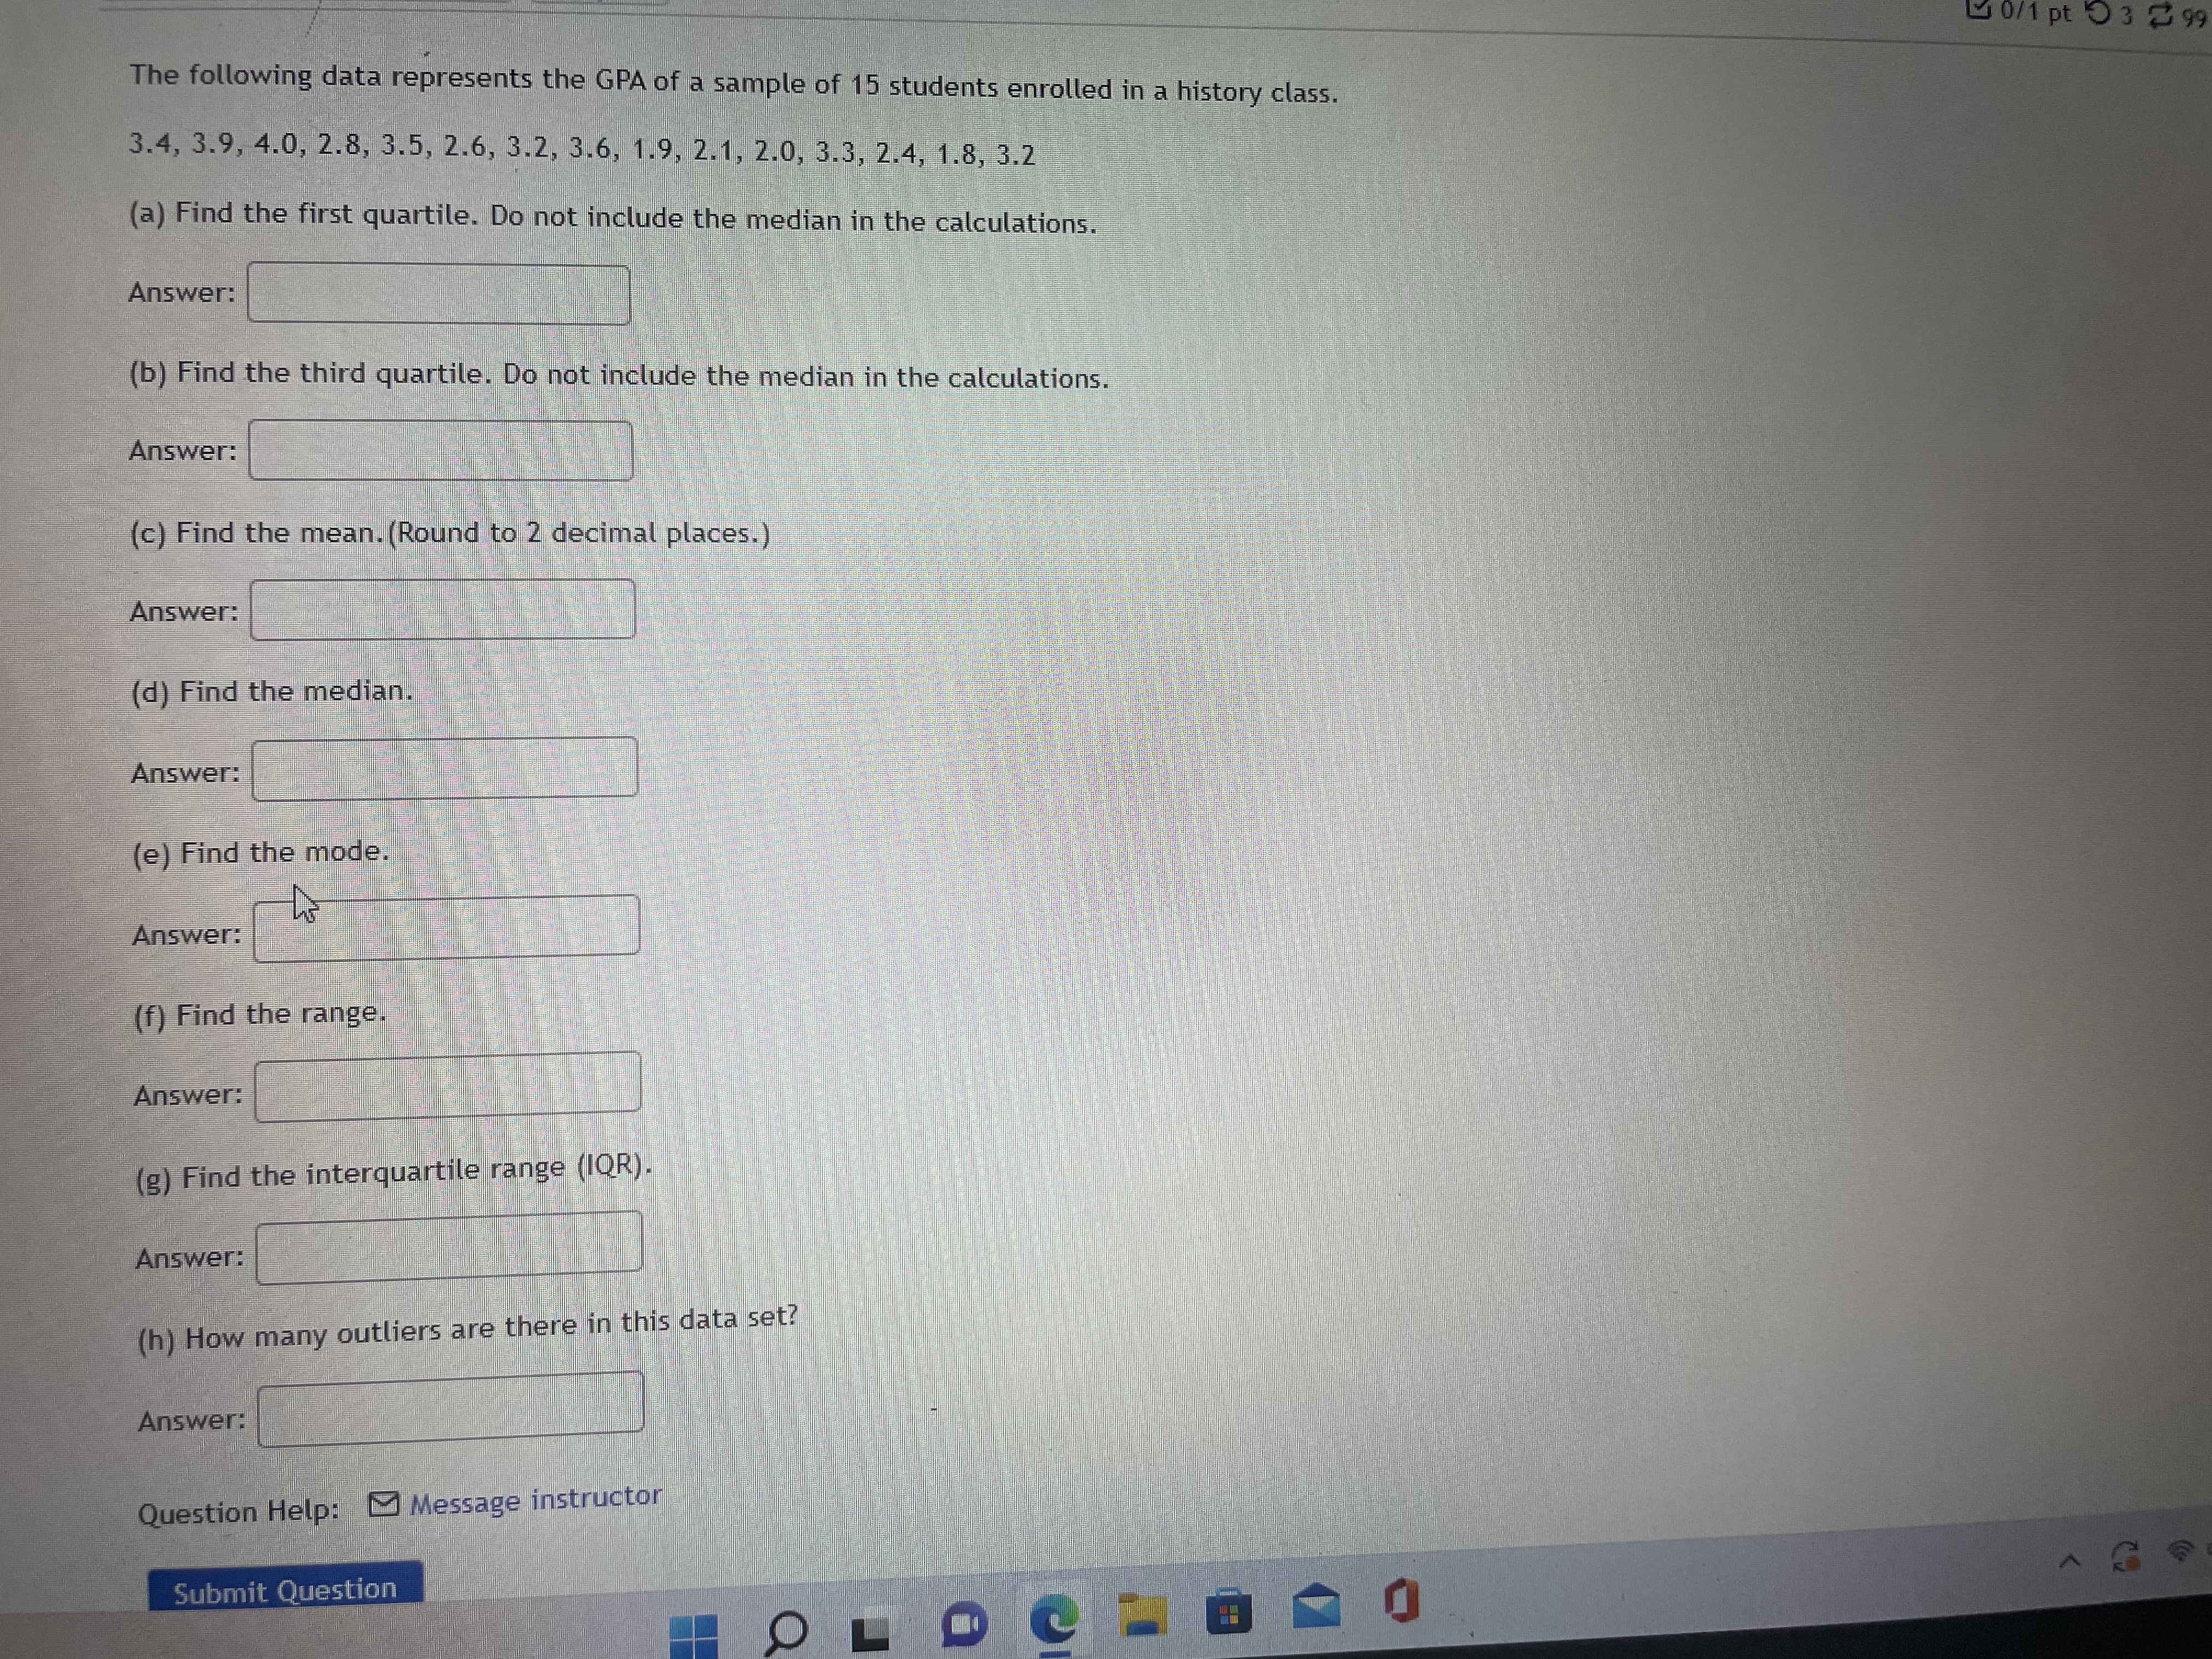
0 : Question 2 0/1 pt 9 3 99 0 Details The boxplot below shows salaries for Construction workers and Teachers. Construction Teacher H 20 25 30 35 40 45 50 Salary (thousands of $) Q Jennie makes the minimum salary for a construction worker. Markos makes the median salary for a teacher. Who makes more money? Markos Jennie How much more? $ Hint: Help Video ) [+] Question Help: Message instructor Submit Question OLOCHBRO0/1 pt 9 3 2 99 @ The following data represents the GPA of a sample of 15 students enrolled in a history class. 3.4, 3.9, 4.0, 2.8, 3.5, 2.6, 3.2, 3.6, 1.9, 2.1, 2.0, 3.3, 2.4, 1.8, 3.2 (a) Find the first quartile. Do not include the median in the calculations. Answer: (b) Find the third quartile. Do not include the median in the calculations. Answer: (c) Find the mean. (Round to 2 decimal places.) Answer: (d) Find the median. Answer: (e) Find the mode. Answer: (f) Find the rangers Answer: (g) Find the interquartile range (IQR). Answer: (h) How many outliers are there in this data set? Answer: Question Help: Message instructor Submit Questiongress saved Done Question 8 0/1 pt 0 3 99 0 The five number summary of a dataset was found to be: 0, 2, 8, 12, 19 An observation is considered an outlier if it is below: An observation is considered an outlier if it is above: Question Help: Message instructor Submit QuestionScore: 2163/11 3/11 answered Question 7 60/1 pt 0 329 Here is a set of sample data 2 8 13 15 23 26 32 38 45 53 7 66 67 85 Identify the 5 number summary (min, Q1, median, Q3, max) Hint: Help Video Z [+] Question Help: Message instructor Submit Question0/1 pt 0 3 2 99 The following data represents the GPA of a sample of 15 students enrolled in a history class. 3.4, 3.9, 4.0, 2.8, 3.5, 2.6, 3.2, 3.6, 1.9, 2.1, 2.0, 3.3, 2.4, 1.8, 3.2 (a) Find the first quartile. Do not include the median in the calculations. Answer: (b) Find the third quartile. Do not include the median in the calculations. Answer: (c) Find the mean. (Round to 2 decimal places.) Answer: (d) Find the median. Answer: (e) Find the mode. Answer: (f) Find the range. Answer: (g) Find the interquartile range (IQR) Answer: (h) How many outliers are there in this data set? Answer: Question Help: Message instructor Submit QuestionOf Location Score: 2:63/11 3/11 answered Progress saved Done B & V0 0 0 : ments Question 1
Step by Step Solution
There are 3 Steps involved in it

Get step-by-step solutions from verified subject matter experts