

Question: stats hw help 4. a) Use the RANDBETWEEN function in Excel to generate the following. Set 1 consists of 20 random numbers between 1 and
stats hw help
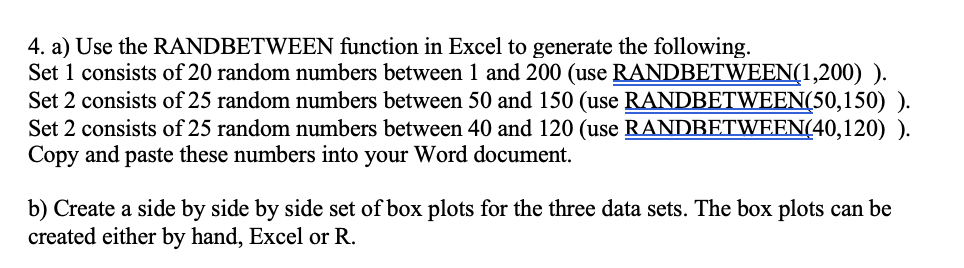
4. a) Use the RANDBETWEEN function in Excel to generate the following. Set 1 consists of 20 random numbers between 1 and 200 (use WIQOO) ). Set 2 consists of 25 random numbers between 50 and 150 (use WSOJSO) ). Set 2 consists of 25 random numbers between 40 and 120 (use wanna) ). Copy and paste these numbers into your Word document. b) Create a side by side by side set of box plots for the three data sets. The box plots can be created either by hand, Excel or R
Step by Step Solution
There are 3 Steps involved in it
1 Expert Approved Answer
Step: 1 Unlock

Question Has Been Solved by an Expert!
Get step-by-step solutions from verified subject matter experts
Step: 2 Unlock
Step: 3 Unlock