

Question: Step 2: Use the Data Analysis package to run a Regression where you use Years to predict Yield . Step 3: Use relative cell references
Step 2: Use the Data Analysis package to run a Regression where you use Years to predict Yield.
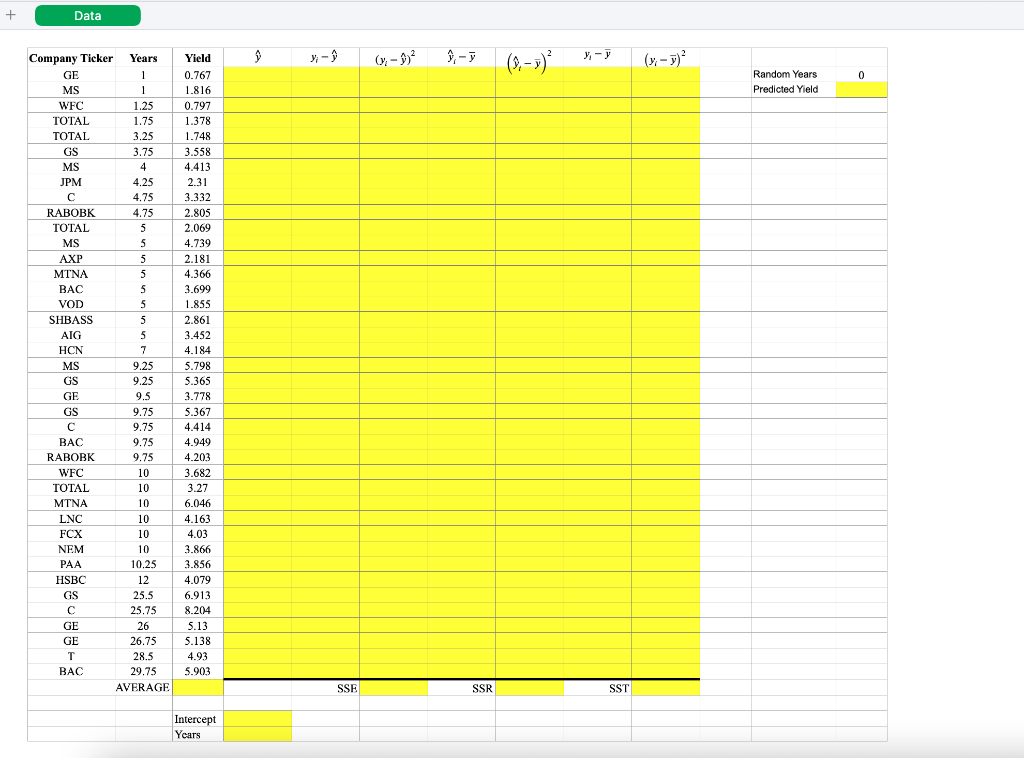
Step 3: Use relative cell references to display the coefficients for Intercept and Years from the Regression Report in cells D44:D45 on the Data worksheet.
Step 4: Use the Regression Coefficients you entered in Step 3 to predict the Yield values for each company, based on the Years for that row. Enter the results in range D2:D41. Remember, hard-coding is NOT permitted and will result in zero credit.
Step 5: Calculate the Residuals (aka Regression Errors) for each predicted value from Step 4, and enter the results in range E2:E41.
Step 6: Use the Residuals calculated in Step 5 to compute the Sum of Squares due to Error (SSE) in Cell F42, using Cells F2:41 for the intermediate computation of the Squared Residuals.
Step 7: Follow a similar process from Steps 5 and 6 to compute the Sum of Squares due to Regression (SSR) in Cell H42. To do so, you will need to compute the y-bar in Cell C42, and you should use cells G2:H41 for your other intermediate computations.
Step 8: Now compute the Total Sum of Squares (SST) in Cell J42 by completing the computations in Cells I2:J41.
Step 9: Compare your results for SSE, SSR, and SST to the SS column of the ANOVA table in your Regression Output generated in Step 2. If your computed values do not match the corresponding values from the Regression Output report, review your calculations to identify and correct your mistake.
Step 10: Cell M2 contains a formula that tells Excel to pick a random number each time that formulas are recalculated across the sheet (which by default happens every time that a cell value is changed), so as you are working, you may notice that the value in this cell changes, but don't pay it any mind. Rather, build a formula in cell M3 that predicts the Yield based on the Random Years in cell G2. Note: this step is similar to the process for computing Regression Coefficients in Step 3.
Data Yield , - $ ( - ) - - - (9) - ) y, - | (y - ) Random Years Predicted Yield 0.767 1.816 1.25 0.797 1.75 1.378 3.25 1.748 3.75 3.558 4 4.413 4.25 231 4.75 3.332 4.75 2.805 5 2.069 34.739 32.181 4.300 less 3.45 74.184 a 1 4 = 5 - = 1 3.27 6.046 14.163 4.03 3.866 3.856 6.913 SSE SSR Intercept Years Data Yield , - $ ( - ) - - - (9) - ) y, - | (y - ) Random Years Predicted Yield 0.767 1.816 1.25 0.797 1.75 1.378 3.25 1.748 3.75 3.558 4 4.413 4.25 231 4.75 3.332 4.75 2.805 5 2.069 34.739 32.181 4.300 less 3.45 74.184 a 1 4 = 5 - = 1 3.27 6.046 14.163 4.03 3.866 3.856 6.913 SSE SSR Intercept Years
Step by Step Solution
There are 3 Steps involved in it

Get step-by-step solutions from verified subject matter experts