

Question: Step 3: Use the a-table to look up the z-score You calculated in step 2. Step 4: Draw a graph and plot the z-score and
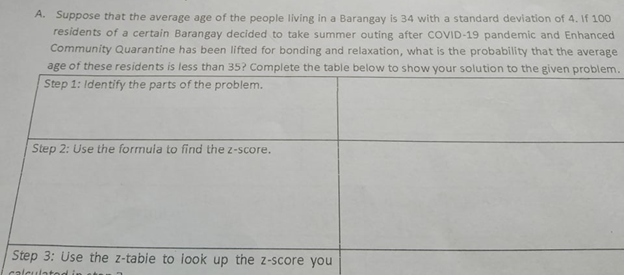
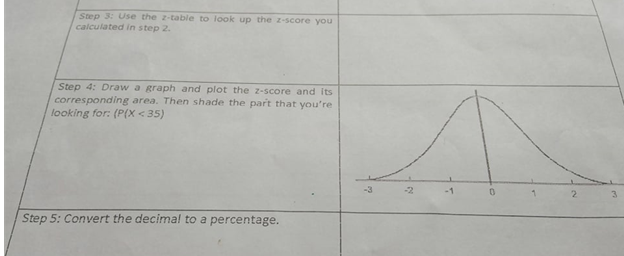

Step 3: Use the a-table to look up the z-score You calculated in step 2. Step 4: Draw a graph and plot the z-score and Its corresponding area. Then shade the part that you're looking for (P(X
Step by Step Solution
There are 3 Steps involved in it
1 Expert Approved Answer
Step: 1 Unlock

Question Has Been Solved by an Expert!
Get step-by-step solutions from verified subject matter experts
Step: 2 Unlock
Step: 3 Unlock