

Question: Step 7 - Create a graph to visualize the trading data of the 5 stocks and the DIIA. In a new worksheet, named All Closing,
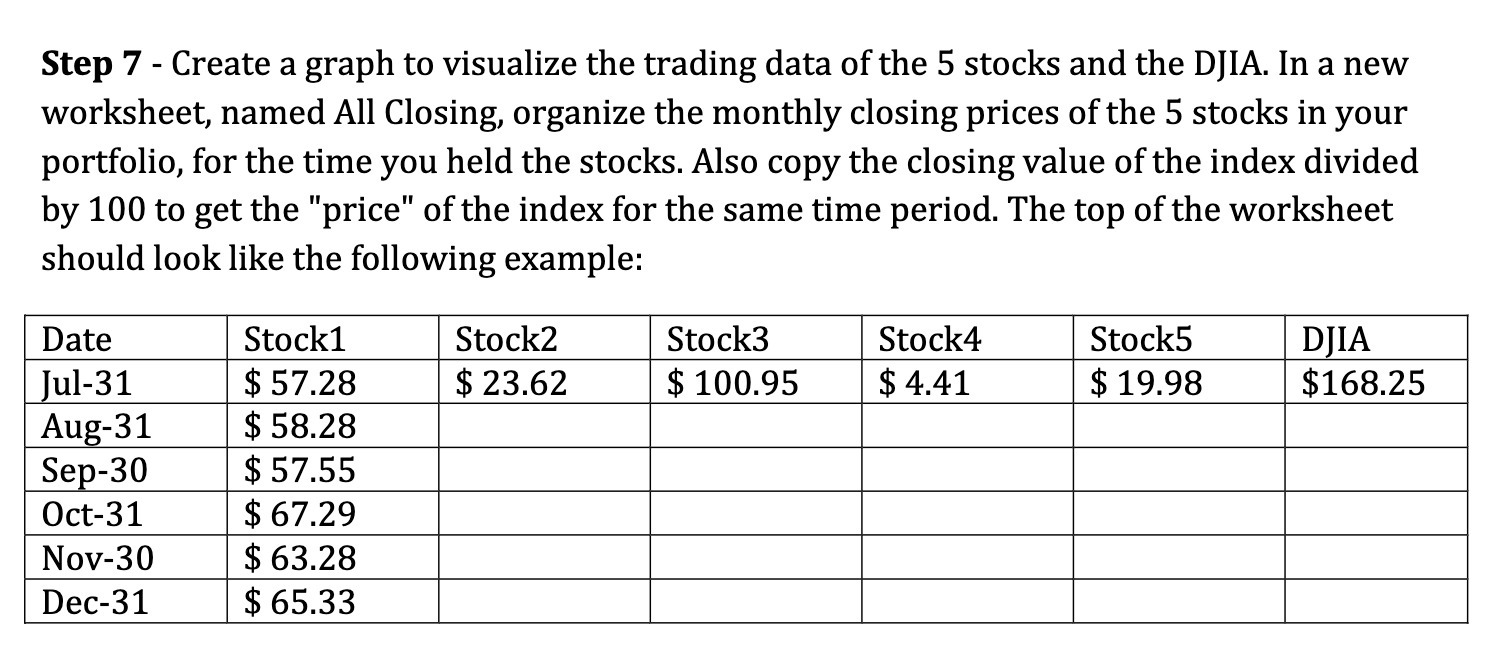
Step 7 - Create a graph to visualize the trading data of the 5 stocks and the DIIA. In a new worksheet, named All Closing, organize the monthly closing prices of the 5 stocks in your portfolio, for the time you held the stocks. Also copy the closing value of the index divided by 100 to get the "price" of the index for the same time period. The top of the worksheet should look like the following example: ul-31 $ 57.28 $ 23.62 $ 100.95 $ 4.4-1 $ 19.98 $168.25 Au.-31 $ 58.28 __ Se . -30 $57-55 _ _ Oct-31 $ 67.29 Nov-30 $ 63.28 Dec-31 $ 65.33
Step by Step Solution
There are 3 Steps involved in it
1 Expert Approved Answer
Step: 1 Unlock

Question Has Been Solved by an Expert!
Get step-by-step solutions from verified subject matter experts
Step: 2 Unlock
Step: 3 Unlock