

Question: step by step excel solution please Homework 3 Immersive Reader Ope 2. Given the following information about mistakes made on tax forms, make and interpret
step by step excel solution please
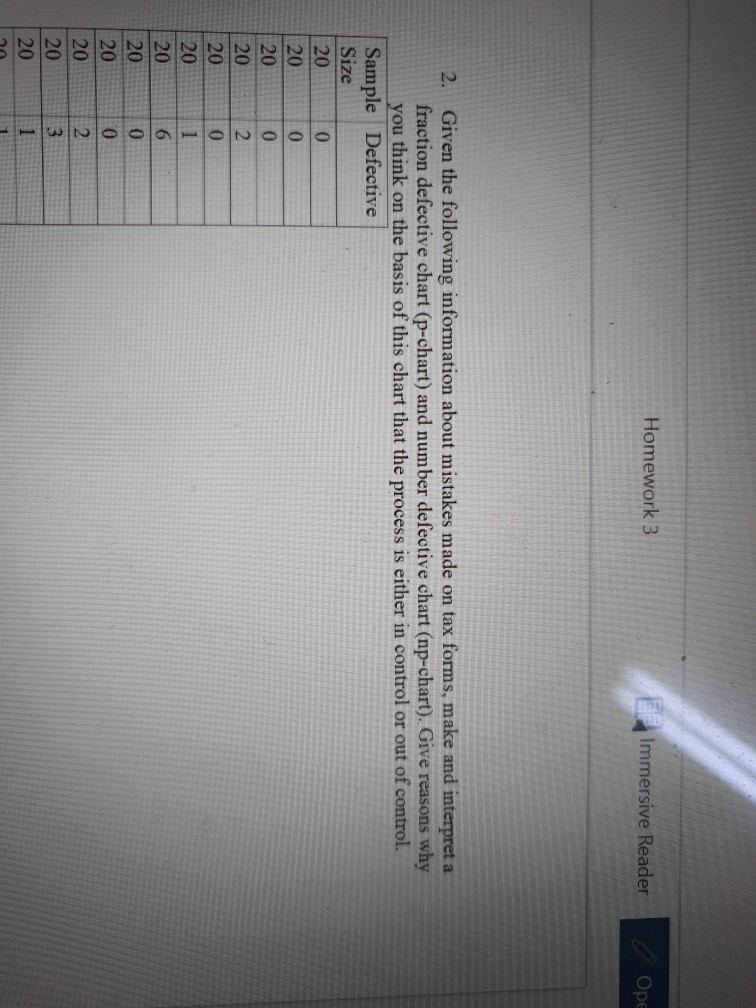
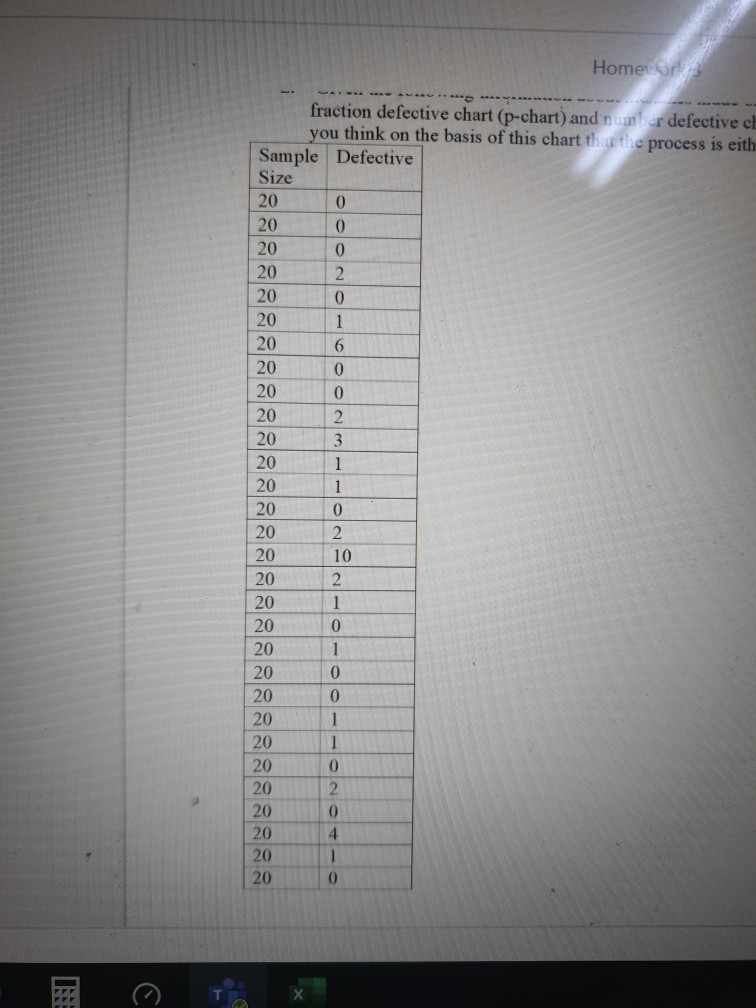
Homework 3 Immersive Reader Ope 2. Given the following information about mistakes made on tax forms, make and interpret a fraction defective chart (p-chart) and number defective chart (np-chart). Give reasons why you think on the basis of this chart that the process is either in control or out of control. Sample Defective Size 20 0 20 0 20 0 20 2. 20 0 20 20 6 20 0 20 O 20 2 20 3 20 1 Homero fraction defective chart (p-chart) and number defective ct you think on the basis of this chart that the process is eith Sample Defective Size 20 20 20 0 20 0 0 2. 20 0 1 6 0 0 2 3 0 2 10 2 20 20 20 20 20 20 20 20 20 20 20 20 20 20 20 20 20 20 20 20 20 20 20 20 20 1 0 1 0 0 0 2 0 4 0Step by Step Solution
There are 3 Steps involved in it
1 Expert Approved Answer
Step: 1 Unlock

Question Has Been Solved by an Expert!
Get step-by-step solutions from verified subject matter experts
Step: 2 Unlock
Step: 3 Unlock