

Question: step by step solution please Problem 2: The following data is collected for the number of defective products from a production line over the span
step by step solution please
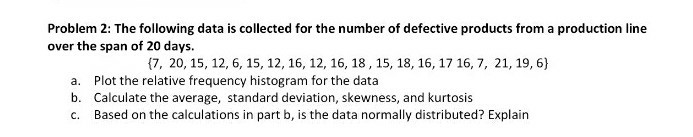
Problem 2: The following data is collected for the number of defective products from a production line over the span of 20 days. {7, 20, 15, 12, 6, 15, 12, 16, 12, 16, 18, 15, 18, 16, 17 16, 7, 21, 19,6) a. Plot the relative frequency histogram for the data b. Calculate the average, standard deviation, skewness, and kurtosis C. Based on the calculations in part b, is the data normally distributed? ExplainStep by Step Solution
There are 3 Steps involved in it
1 Expert Approved Answer
Step: 1 Unlock

Question Has Been Solved by an Expert!
Get step-by-step solutions from verified subject matter experts
Step: 2 Unlock
Step: 3 Unlock