Question: Step Instructions Points Possible Start Excel. Download and open the file named exploring_e03_grader_a1.xlsx. Select the ranges A4:A10, F4:G10 and create a Clustered Column Line on
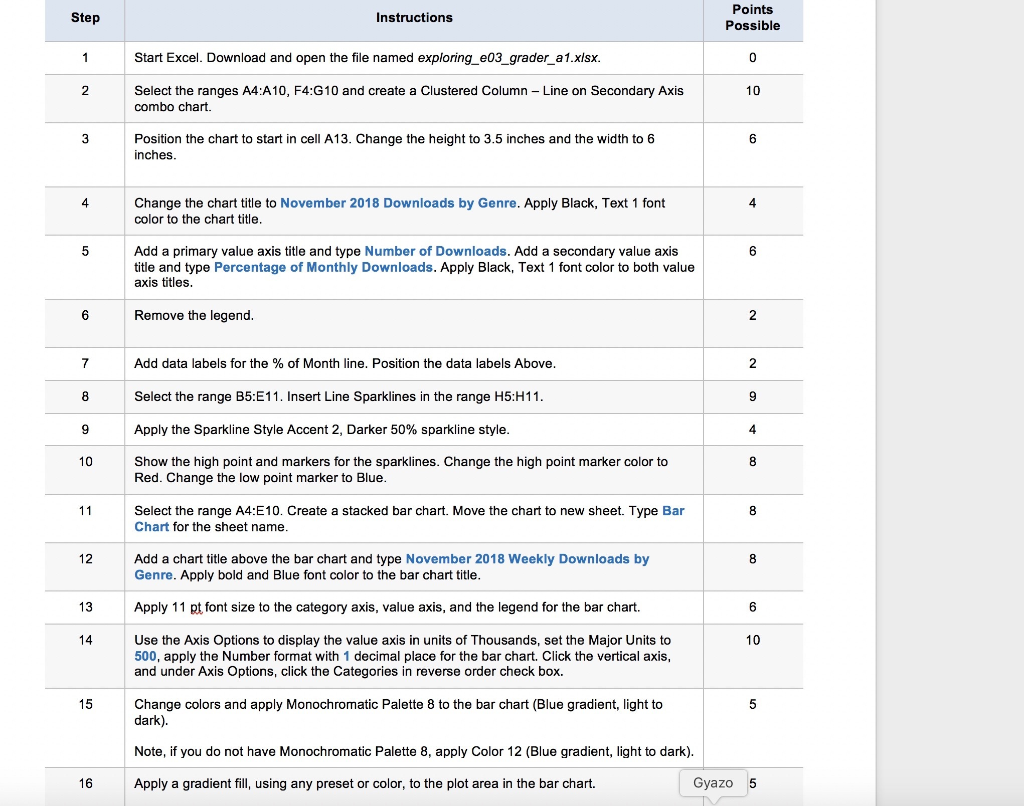
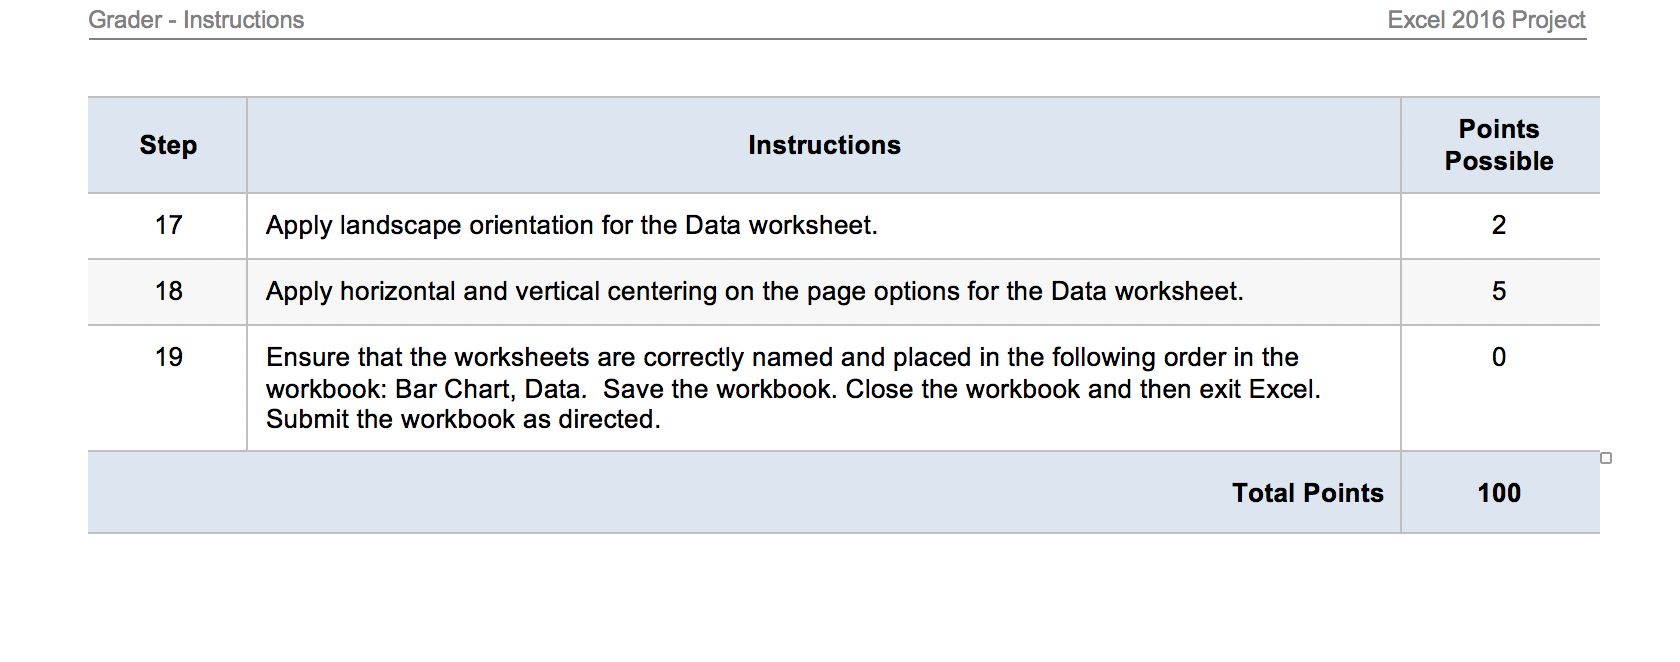
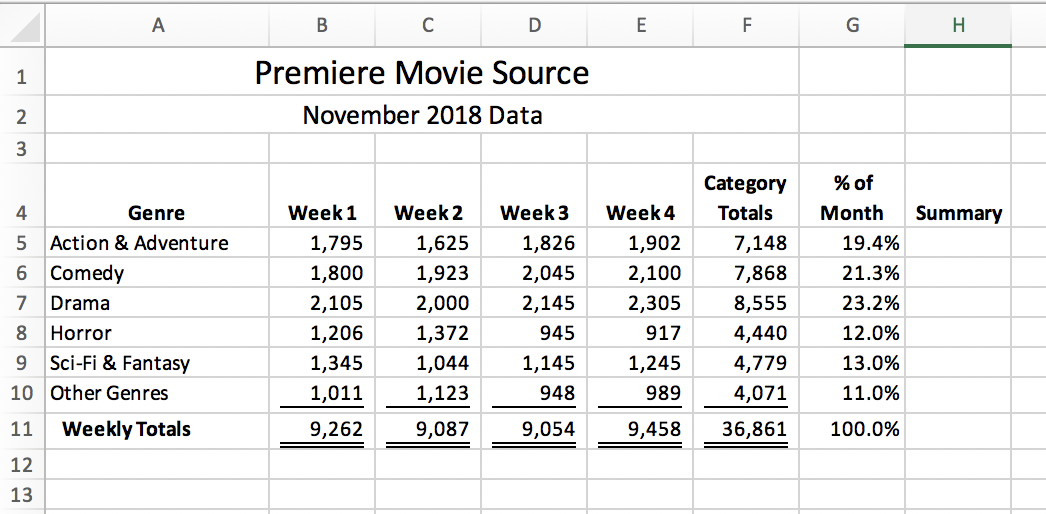
Step Instructions Points Possible Start Excel. Download and open the file named exploring_e03_grader_a1.xlsx. Select the ranges A4:A10, F4:G10 and create a Clustered Column Line on Secondary Axis combo chart. Position the chart to start in cell A13. Change the height to 3.5 inches and the width to 6 inches. Change the chart title to November 2018 Downloads by Genre. Apply Black, Text 1 font color to the chart title. Add a primary value axis title and type Number of Downloads. Add a secondary value axis title and type Percentage of Monthly Downloads. Apply Black, Text 1 font color to both value axis titles. Remove the legend. Add data labels for the % of Month line. Position the data labels Above. Select the range B5:E11. Insert Line Sparklines in the range H5:H11. Apply the Sparkline Style Accent 2, Darker 50% sparkline style. Show the high point and markers for the sparklines. Change the high point marker color to Red. Change the low point marker to Blue. Select the range A4:E10. Create a stacked bar chart. Move the chart to new sheet. Type Bar Chart for the sheet name. Add a chart title above the bar chart and type November 2018 Weekly Downloads by Genre. Apply bold and Blue font color to the bar chart title. Apply 11 Rt font size to the category axis, value axis, and the legend for the bar chart. Use the Axis Options to display the value axis in units of Thousands, set the Major Units to 500, apply the Number format with 1 decimal place for the bar chart. Click the vertical axis, and under Axis Options, click the Categories in reverse order check box. Change colors and apply Monochromatic Palette 8 to the bar chart (Blue gradient, light to dark). Note, if you do not have Monochromatic Palette 8, apply Color 12 (Blue gradient, light to dark). 16 Apply a gradient fill, using any preset or color, to the plot area in the bar chart. Gyazo 5 Grader - Instructions Excel 2016 Project Step Instructions Points Possible Apply landscape orientation for the Data worksheet. Apply horizontal and vertical centering on the page options for the Data worksheet. 0 Ensure that the worksheets are correctly named and placed in the following order in the workbook: Bar Chart, Data. Save the workbook. Close the workbook and then exit Excel. Submit the workbook as directed. Total Points 100 E F G H B C D Premiere Movie Source November 2018 Data Summary 5 6 Week 3 1,826 2,045 2,145 Genre Action & Adventure Comedy Drama Horror Sci-Fi & Fantasy Other Genres Weekly Totals Week 1 1,795 1,800 2,105 1,206 1,345 1,011 9,262 7 Week 2 1,625 1,923 2,000 1,372 1,044 1,123 9,087 Category Totals 7,148 7,868 8,555 4,440 4,779 4,071 Week 4 1,902 2,100 2,305 917 1,245 989 % of Month 19.4% 21.3% 23.2% 12.0% 13.0% 11.0% 945 9 1,145 948 10 9,054 9,458 36,861 100.0%


