

Question: stion b The box plot below shows the amount spent for books and supplies per year by students at community colleges. 320 360 380 400
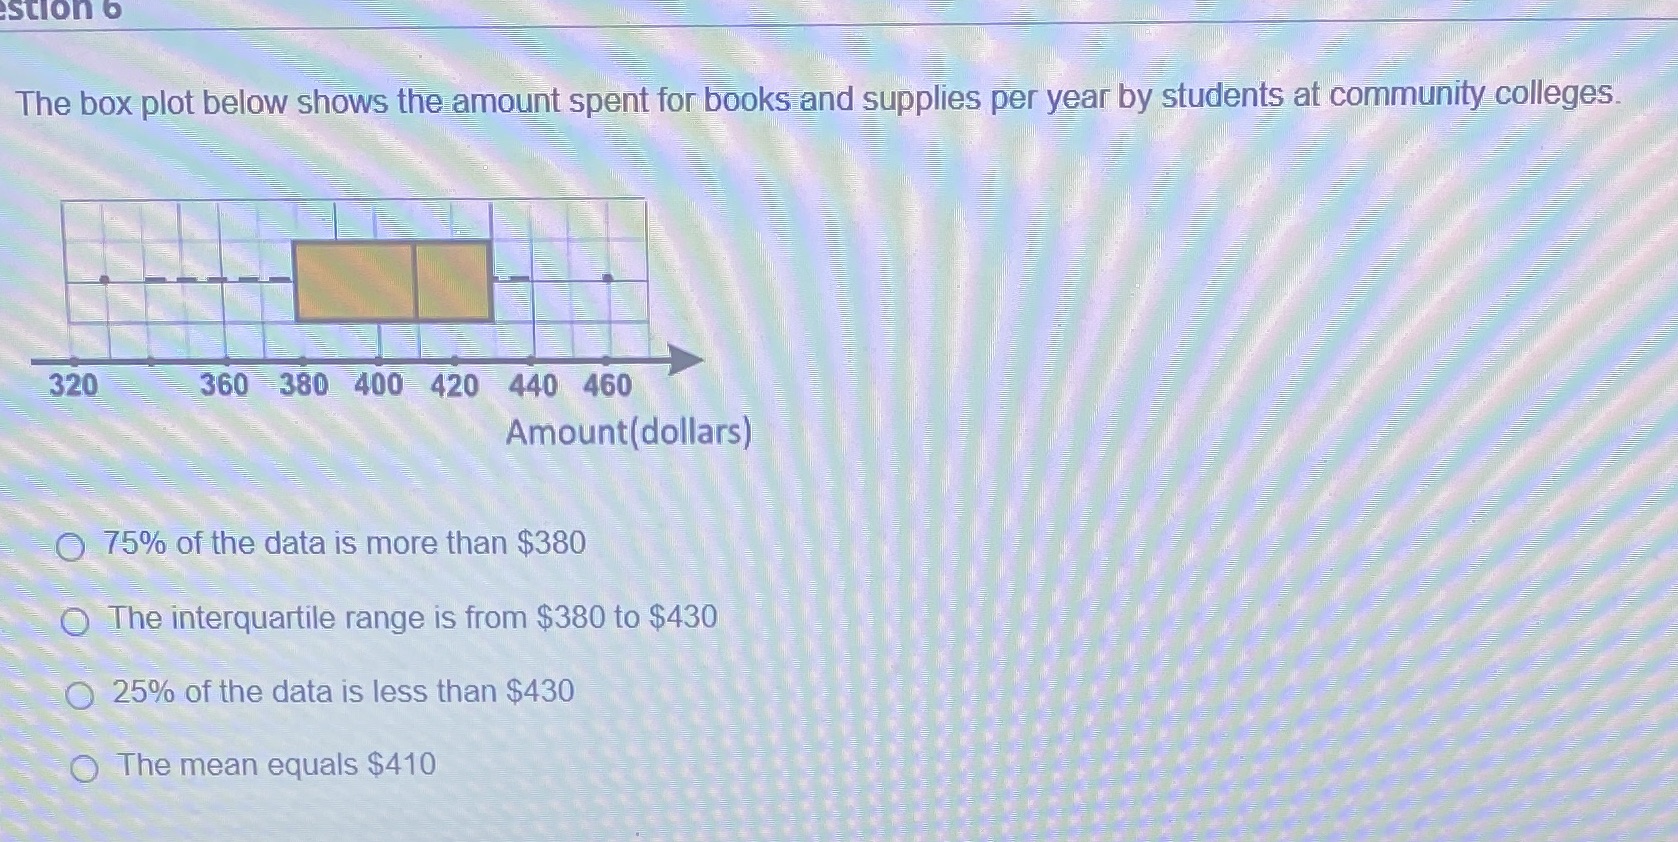
stion b The box plot below shows the amount spent for books and supplies per year by students at community colleges. 320 360 380 400 420 440 460 Amount(dollars) 75% of the data is more than $380 The interquartile range is from $380 to $430 25% of the data is less than $430 O The mean equals $410
Step by Step Solution
There are 3 Steps involved in it
1 Expert Approved Answer
Step: 1 Unlock

Question Has Been Solved by an Expert!
Get step-by-step solutions from verified subject matter experts
Step: 2 Unlock
Step: 3 Unlock