

Question: Study the line graph carefully and answer the questions given. Data regarding the number of people who were tested positive with COVID-19 during February,


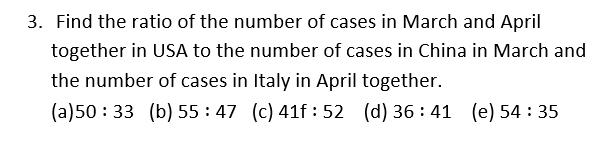
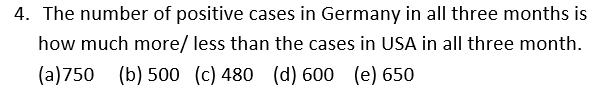
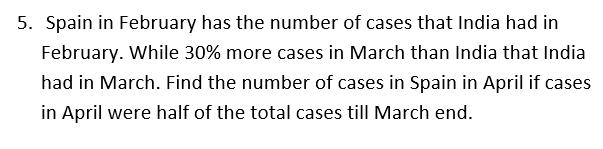
Study the line graph carefully and answer the questions given. Data regarding the number of people who were tested positive with COVID-19 during February, March and April in five countries. 5000 4500 4000 3500 3000 2500 2000 1500 1000 China USA Germany J Italy India -Febuary -March -April 1. The average number of people per day who were tested positive in India in April. (a) 70 (b) 68 (c) 72 (d) 80.5 (e) 76 2. By what percent the number of positive tested people increased in Germany in March from February? (a)14 3/17% (b) 12 %% (c) 29 7/17% (d) 41 3/17% (e) none of these 3. Find the ratio of the number of cases in March and April together in USA to the number of cases in China in March and the number of cases in Italy in April together. (a)5033 (b) 55:47 (c) 41f: 52 (d) 36:41 (e) 54:35 4. The number of positive cases in Germany in all three months is how much more/ less than the cases in USA in all three month. (a) 750 (b) 500 (c) 480 (d) 600 (e) 650 5. Spain in February has the number of cases that India had in February. While 30% more cases in March than India that India had in March. Find the number of cases in Spain in April if cases in April were half of the total cases till March end.
Step by Step Solution
3.41 Rating (145 Votes )
There are 3 Steps involved in it
The detailed answer for the above question is provided below The average number of people per day who were tested positive in India in April 70 b 68 c 72 d 805 e 76 Solution Given Tested positive in C... View full answer

Get step-by-step solutions from verified subject matter experts