

Question: subject: engineered quality need assignment help questions - 1 to 11 Week 7 Homework Assignment Answer the following Statistical Application Questions from Chapter 6: 1.
subject: engineered quality need assignment help questions - 1 to 11
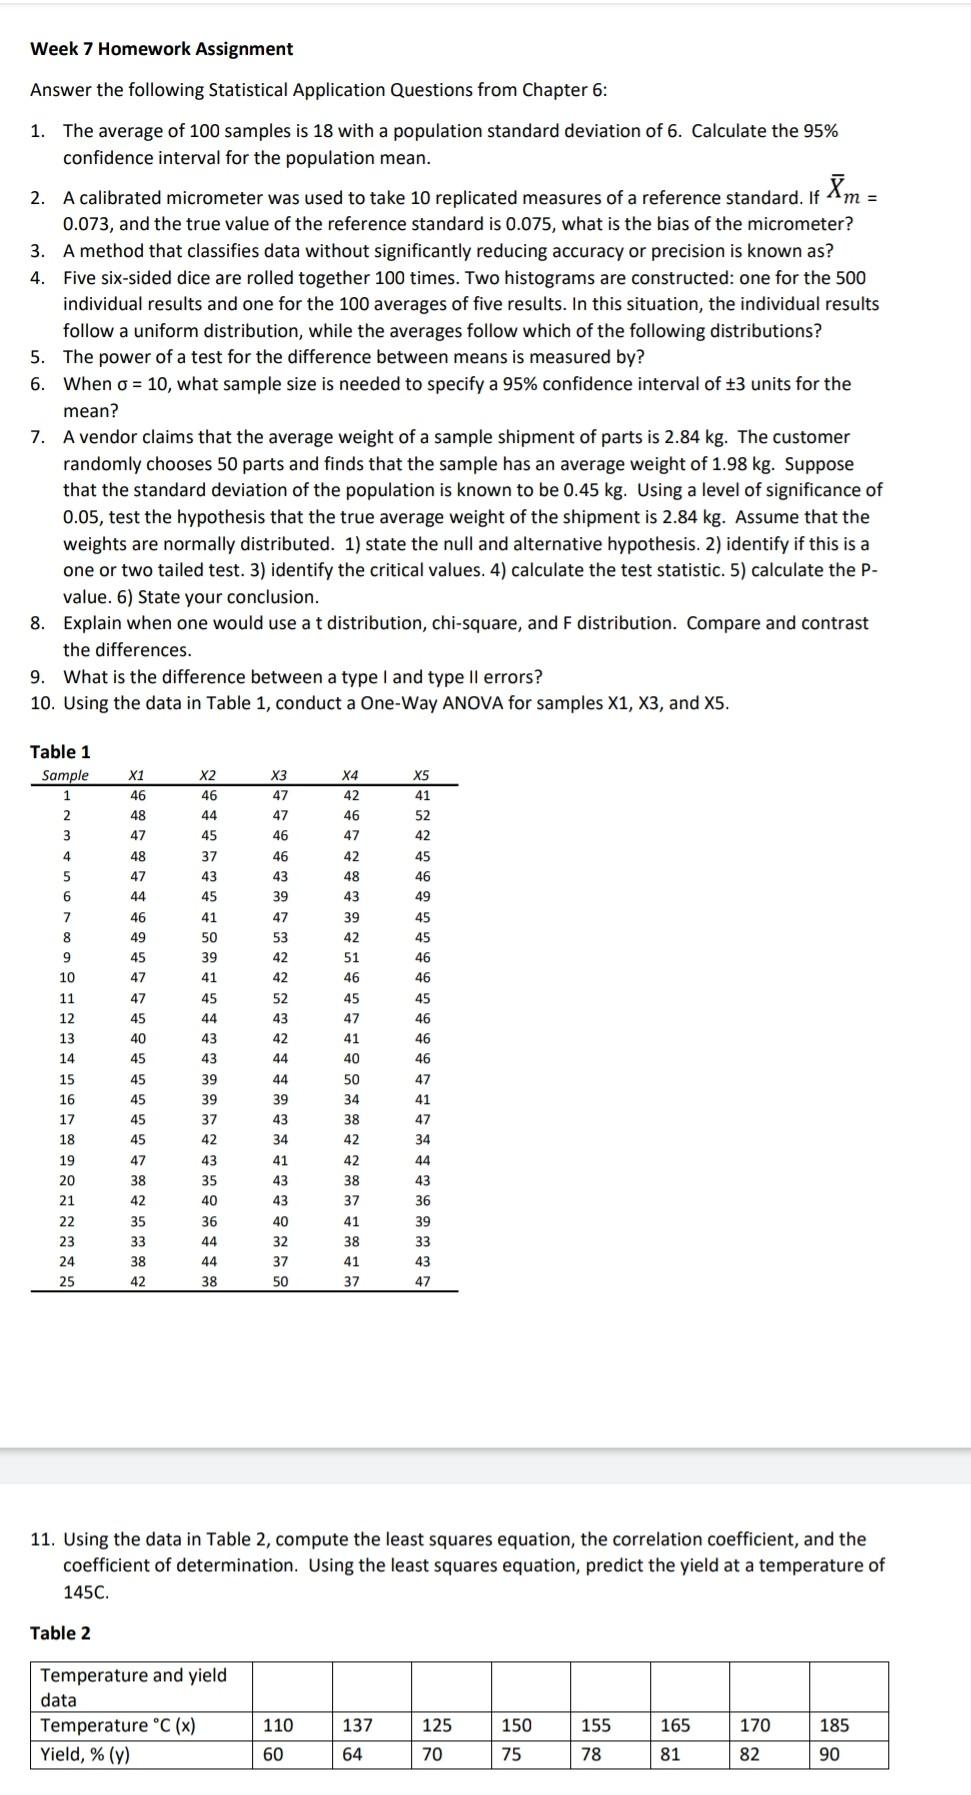
Week 7 Homework Assignment Answer the following Statistical Application Questions from Chapter 6: 1. The average of 100 samples is 18 with a population standard deviation of 6. Calculate the 95% confidence interval for the population mean. 2. A calibrated micrometer was used to take 10 replicated measures of a reference standard. If Im = 0.073, and the true value of the reference standard is 0.075, what is the bias of the micrometer? 3. A method that classifies data without significantly reducing accuracy or precision is known as? 4. Five six-sided dice are rolled together 100 times. Two histograms are constructed: one for the 500 individual results and one for the 100 averages of five results. In this situation, the individual results follow a uniform distribution, while the averages follow which of the following distributions? 5. The power of a test for the difference between means is measured by? 6. When o = 10, what sample size is needed to specify a 95% confidence interval of +3 units for the mean? 7. A vendor claims that the average weight of a sample shipment of parts is 2.84 kg. The customer randomly chooses 50 parts and finds that the sample has an average weight of 1.98 kg. Suppose that the standard deviation of the population is known to be 0.45 kg. Using a level of significance 0.05, test the hypothesis that the true average weight of the shipment is 2.84 kg. Assume that the weights are normally distributed. 1) state the null and alternative hypothesis. 2) identify if this is a one or two tailed test. 3) identify the critical values. 4) calculate the test statistic. 5) calculate the P- value. 6) State your conclusion. 8. Explain when one would use a t distribution, chi-square, and F distribution. Compare and contrast the differences. 9. What is the difference between a type I and type II errors? 10. Using the data in Table 1, conduct a One-Way ANOVA for samples X1, X3, and X5. X5 Table 1 Sample 1 2 3 X1 46 X2 46 X3 47 41 X4 42 46 47 52 48 47 44 45 47 46 42 45 4 5 6 48 47 44 46 49 45 47 42 48 43 39 42 46 49 45 45 7 8 9 10 46 46 51 46 45 47 11 47 46 43 39 47 53 42 42 52 43 42 44 44 39 43 34 45 12 45 46 13 40 41 46 14 45 40 37 43 45 41 50 39 41 45 44 43 43 39 39 37 42 43 35 40 36 44 44 38 46 15 45 50 47 16 45 34 41 17 45 38 47 18 45 34 19 20 21 22 47 38 42 41 43 42 42 38 37 41 44 43 36 39 35 33 23 40 32 37 50 38 41 24 38 33 43 47 25 42 37 11. Using the data in Table 2, compute the least squares equation, the correlation coefficient, and the coefficient of determination. Using the least squares equation, predict the yield at a temperature of 145C. Table 2 Temperature and yield data Temperature C (x) Yield, % (y) 110 137 125 150 155 165 185 170 82 60 64 70 75 78 81 90
Step by Step Solution
There are 3 Steps involved in it
1 Expert Approved Answer
Step: 1 Unlock

Question Has Been Solved by an Expert!
Get step-by-step solutions from verified subject matter experts
Step: 2 Unlock
Step: 3 Unlock