

Question: Summarize the results shown in the third column Table 1. Table 1 Means, standard deviations, and correlations among variables Variables M (SD) M (SD) /
Summarize the results shown in the third column Table 1.
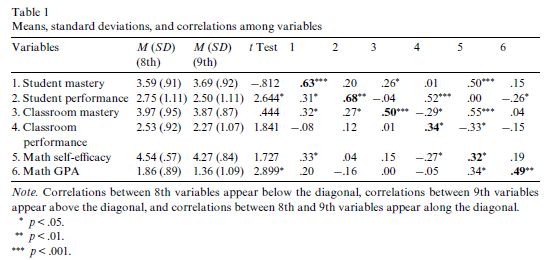
Table 1 Means, standard deviations, and correlations among variables Variables M (SD) M (SD) / Test 1 2 4 5 (8th) (9th) 1. Student mastery 3.59 (91) 3.69 (.92) -.812 20 .26* .01 .50*+ .15 2. Student performance 2.75 (1.11) 2.50 (1.11) 2.644* .31* .68* -.04 00 -.26* 3. Classroom mastery 3.97 (95) 3.87 (.87) 444 .32* 27* -,29+ .55+ 104 4. Classroom 2.53 (.92) 2.27 (1.07) 1.841 -.08 12 .01 .34* -.33* -.15 performance 5. Math self-efficacy 4.54 (.57) 427 (84) 1.727 .33* 04 .15 -.27* .32* .19 6. Math GPA 1.86 (.89) 1.36 (1.09) 2.899* .20 -.16 .00 -.05 34* .49++ Note. Correlations between 8th variables appear below the diagonal, correlations between 9th variables appear above the diagonal, and correlations between 8th and 9th variables appear along the diagonal. P<.05. p>
Step by Step Solution
There are 3 Steps involved in it

Get step-by-step solutions from verified subject matter experts