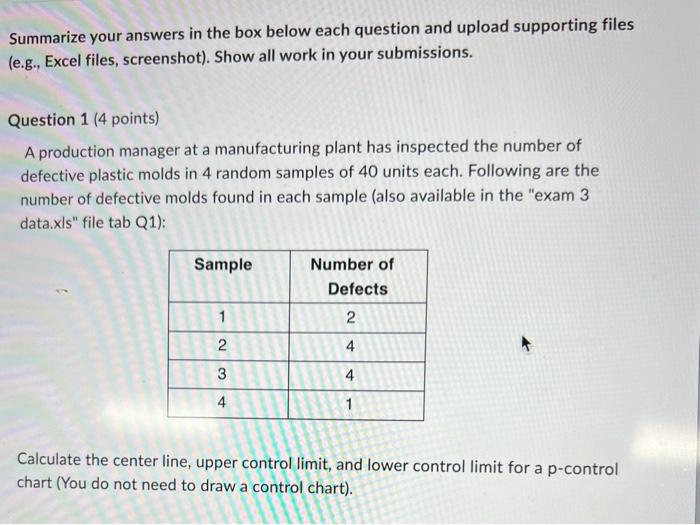
Question: Summarize your answers in the box below each question and upload supporting files (e.g., Excel files, screenshot). Show all work in your submissions. Question 1

Summarize your answers in the box below each
Summarize your answers in the box below each question and upload supporting files (e.g., Excel files, screenshot). Show all work in your submissions. Question 1 (4 points) A production manager at a manufacturing plant has inspected the number of defective plastic molds in 4 random samples of 40 units each. Following are the number of defective molds found in each sample (also available in the "exam 3 data.xIs" file tab Q1): Calculate the center line, upper control limit, and lower control limit for a p-control chart (You do not need to draw a control chart)

Step by Step Solution

There are 3 Steps involved in it

1 Expert Approved Answer
Step: 1 Unlock blur-text-image
Question Has Been Solved by an Expert!

Get step-by-step solutions from verified subject matter experts

Step: 2 Unlock
Step: 3 Unlock

Students Have Also Explored These Related General Management Questions!