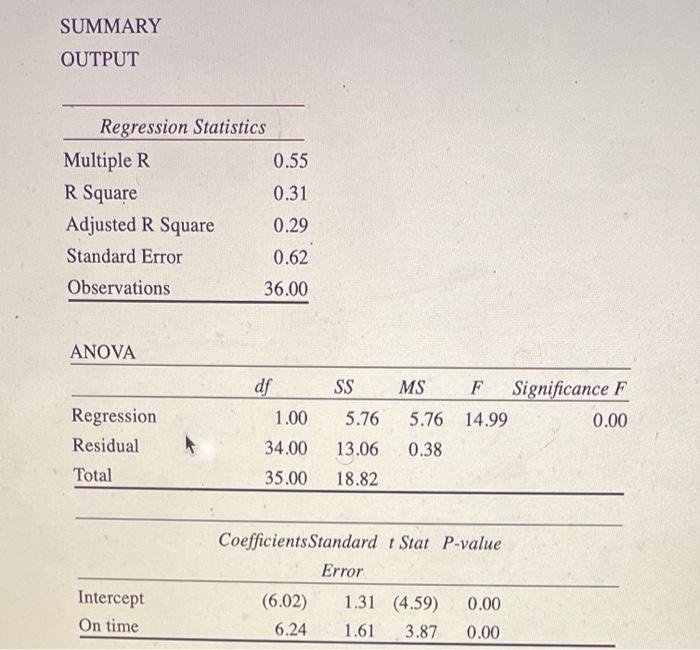
Question: SUMMARY OUTPUT Regression Statistics Multiple R 0.55 R Square 0.31 Adjusted R Square 0.29 Standard Error 0.62 Observations 36.00 ANOVA df SS MS F Significance

SUMMARY OUTPUT Regression Statistics Multiple R
SUMMARY OUTPUT Regression Statistics Multiple R 0.55 R Square 0.31 Adjusted R Square 0.29 Standard Error 0.62 Observations 36.00 ANOVA df SS MS F Significance F Regression 1.00 5.76 5.76 14.99 0.00 Residual 34.00 13.06 0.38 Total 35.00 18.82 Coefficients Standard Stat P-value Error (6.02) 1.31 (4.59) 0.00 Intercept On time 6.24 1.61 3.87 0.00 Based on the SLR model above (y = airline quality ratings, AQR) The model explains how much of the variation in airline quality, AQR 2 decimal places (in decimal form not percentage) A For the overall test of the model we should A. Reject Ho and Accept Ha B. Fail to Reject Ho C. Conclude we have a bad model D. Conclude there is no relationship between on time performance and airline quality ratings If on time percentage is .8 (x=.8) the predicted airline quality rating would be? 2 decimal places A

Step by Step Solution

There are 3 Steps involved in it

1 Expert Approved Answer
Step: 1 Unlock blur-text-image
Question Has Been Solved by an Expert!

Get step-by-step solutions from verified subject matter experts

Step: 2 Unlock
Step: 3 Unlock

Students Have Also Explored These Related General Management Questions!