

Question: SUMMARY OUTPUT Regression Statistics Multiple R 0.945364 R Square 0.893714 Adjusted R 0.88812 Standard E 1.211465 Observatic 61 ANOVA Regression Residual Total df SS
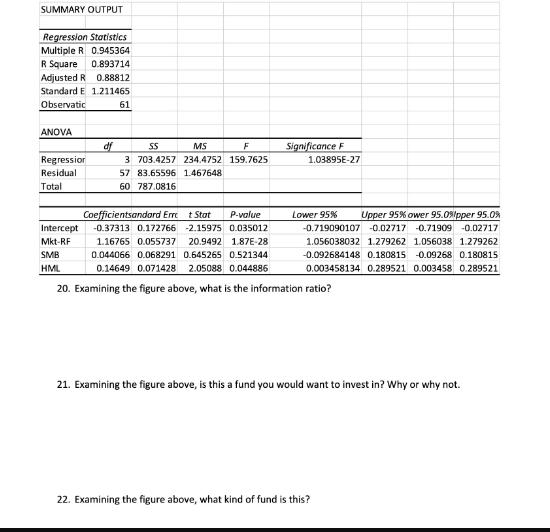
SUMMARY OUTPUT Regression Statistics Multiple R 0.945364 R Square 0.893714 Adjusted R 0.88812 Standard E 1.211465 Observatic 61 ANOVA Regression Residual Total df SS MS F 3 703.4257 234.4752 159.7625 57 83.65596 1.467648 60 787.0816 Coefficientsandard Err Intercept -0.37313 0.172766 Mkt-RF SMB HML Significance F 1.03895E-27 t Stat P-value -2.15975 0.035012 1.16765 0.055737 20.9492 1.87E-28 0.044066 0.068291 0.645265 0.521344 0.14649 0.071428 2.05088 0.044886 20. Examining the figure above, what is the information ratio? Lower 95% Upper 95% ower 95.0%pper 95.0% -0.719090107 -0.02717 -0.71909 -0.02717 1.056038032 1.279262 1.056038 1.279262 -0.092684148 0.180815 -0.09268 0.180815 0.003458134 0.289521 0.003458 0.289521 21. Examining the figure above, is this a fund you would want to invest in? Why or why not. 22. Examining the figure above, what kind of fund is this?
Step by Step Solution
3.34 Rating (169 Votes )
There are 3 Steps involved in it
Based on the information provided 1 The information ratio cannot be determined from the given output ... View full answer

Get step-by-step solutions from verified subject matter experts