

Question: Using the data below, graph the supply and demand curves for metal water bottles of your favourite music group/performer. Price $9.00 20 8.50 8.00
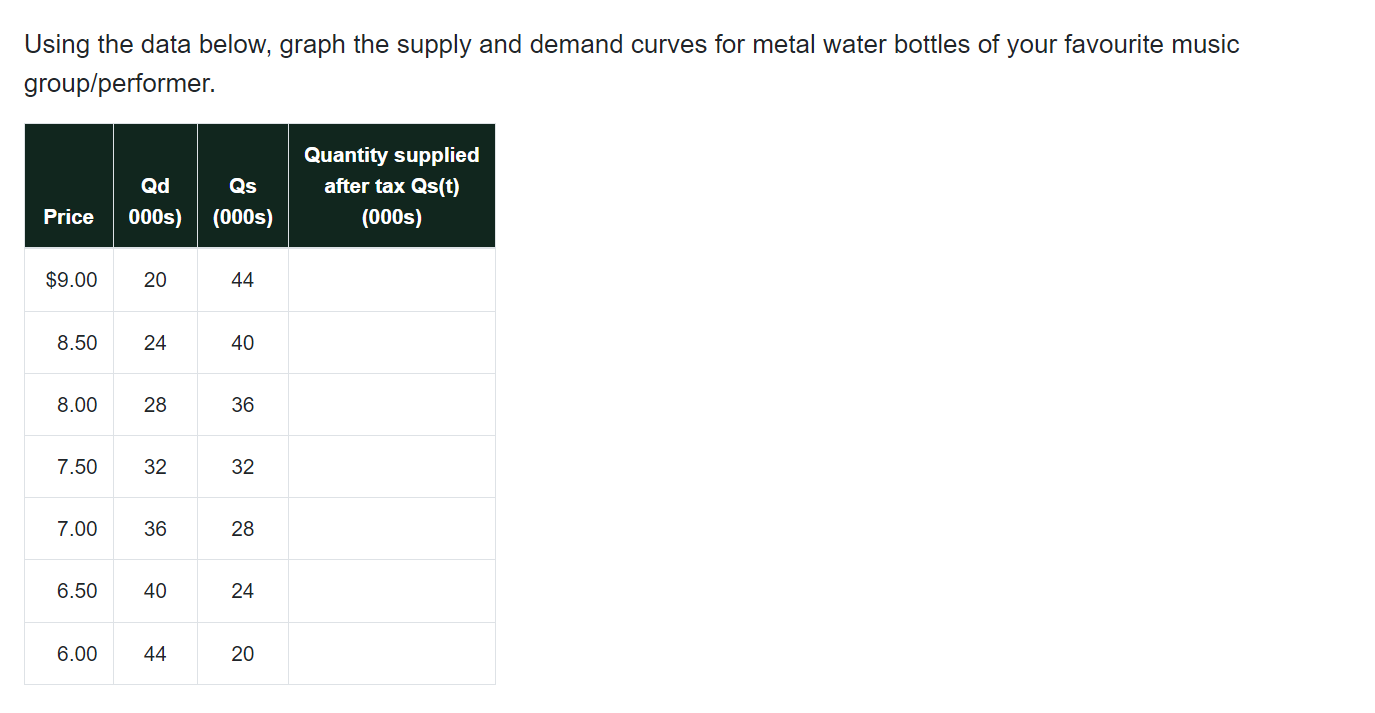
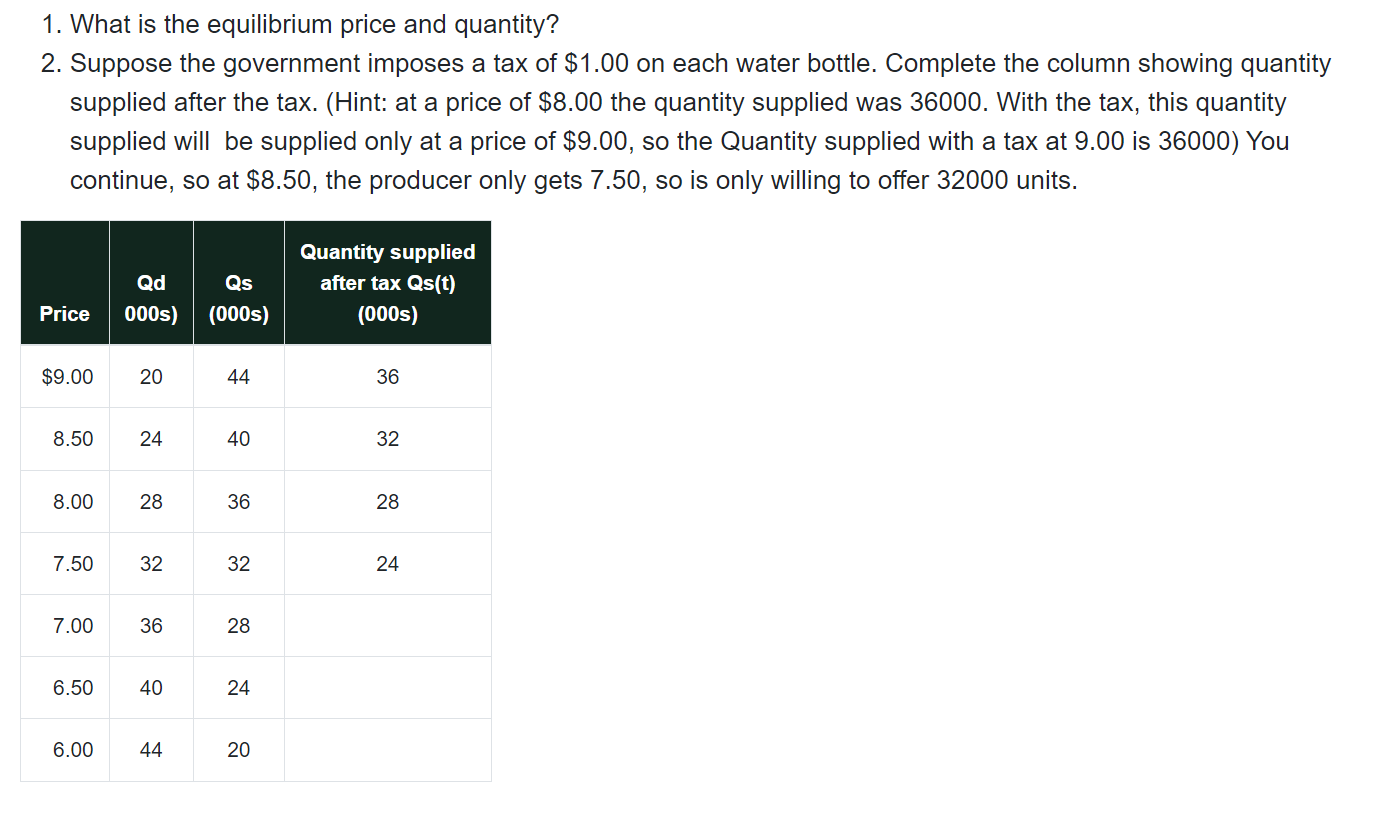
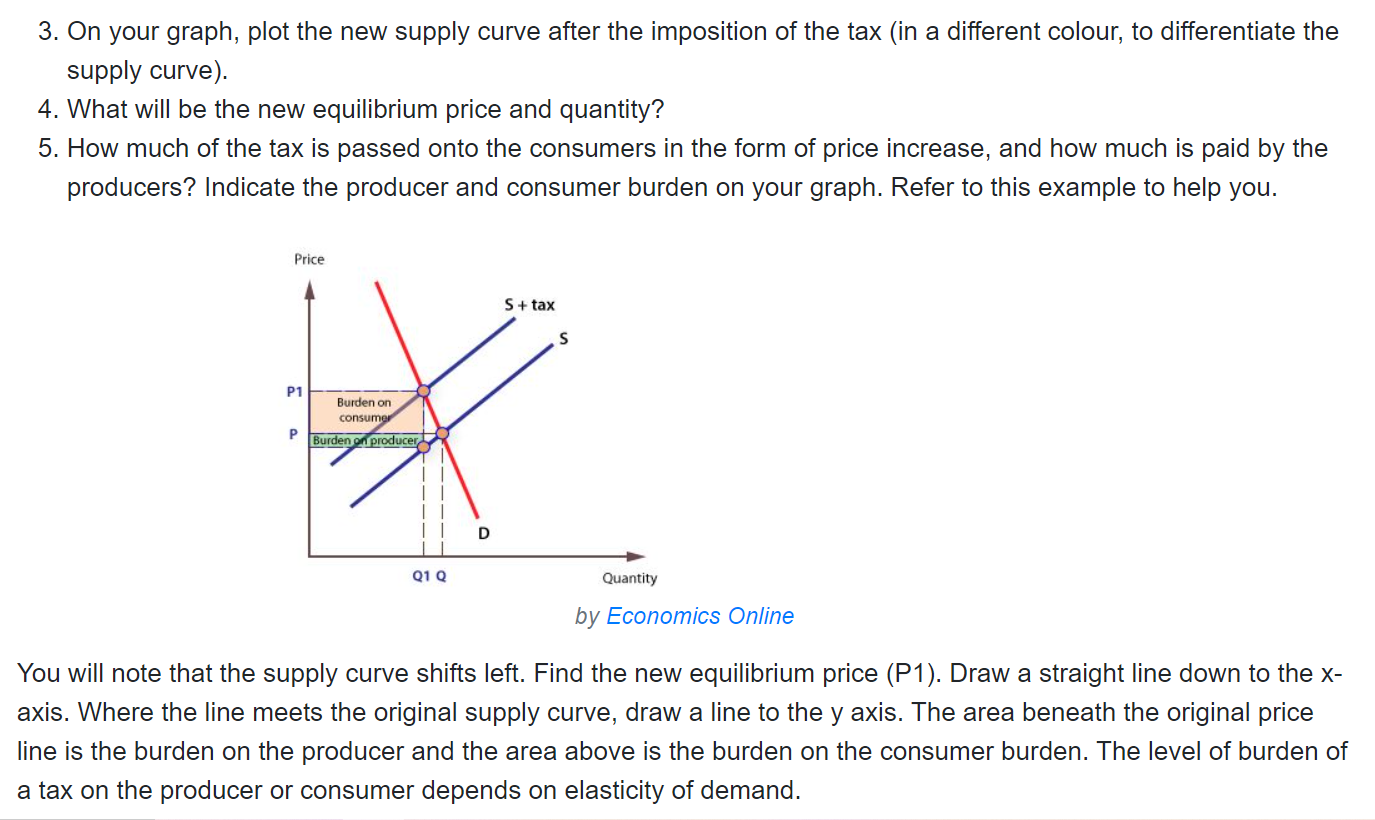
Using the data below, graph the supply and demand curves for metal water bottles of your favourite music group/performer. Price $9.00 20 8.50 8.00 7.50 7.00 6.50 Qd 000s) 6.00 24 28 32 36 40 44 Qs (000s) 44 40 36 32 28 24 20 Quantity supplied after tax Qs(t) (000s) 1. What is the equilibrium price and quantity? 2. Suppose the government imposes a tax of $1.00 on each water bottle. Complete the column showing quantity supplied after the tax. (Hint: at a price of $8.00 the quantity supplied was 36000. With the tax, this quantity supplied will be supplied only at a price of $9.00, so the Quantity supplied with a tax at 9.00 is 36000) You continue, so at $8.50, the producer only gets 7.50, so is only willing to offer 32000 units. Qd Qs Price 000s) (000s) $9.00 20 8.50 24 8.00 7.50 7.00 6.50 6.00 28 32 36 40 44 44 40 36 32 28 24 20 Quantity supplied after tax Qs(t) (000s) 36 32 28 24 3. On your graph, plot the new supply curve after the imposition of the tax (in a different colour, to differentiate the supply curve). 4. What will be the new equilibrium price and quantity? 5. How much of the tax is passed onto the consumers in the form of price increase, and how much is paid by the producers? Indicate the producer and consumer burden on your graph. Refer to this example to help you. Price P1 P Burden on consumer Burden on producer Q1 Q S + tax S Quantity by Economics Online You will note that the supply curve shifts left. Find the new equilibrium price (P1). Draw a straight line down to the x- axis. Where the line meets the original supply curve, draw a line to the y axis. The area beneath the original price line is the burden on the producer and the area above is the burden on the consumer burden. The level of burden of a tax on the producer or consumer depends on elasticity of demand.
Step by Step Solution
There are 3 Steps involved in it
Here is the graph with the supply and demand curves for metal water bottles A graph is shown with th... View full answer

Get step-by-step solutions from verified subject matter experts