

Question: Summary statistics: Column n Mean Variance Std. dev. Std. err. Median Range Min Max Q1 Q3 Random Dice Roll 1000 6.962 5.9805365 2.4455136 0.077333929 7

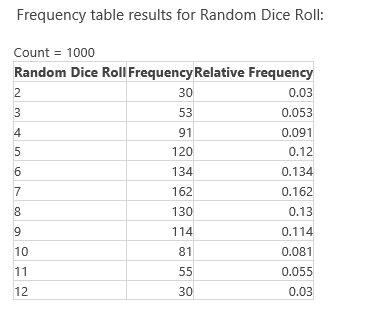
Summary statistics: Column n Mean Variance Std. dev. Std. err. Median Range Min Max Q1 Q3 Random Dice Roll 1000 6.962 5.9805365 2.4455136 0.077333929 7 10 2 12 5 9Frequency table results for Random Dice Roll: Count = 1000 Random Dice Roll Frequency Relative Frequency 30 0.03 53 0.053 91 0.091 120 0.12 134 0.134 162 0.162 130 0.13 114 0.114 10 81 0.081 11 55 0.055 12 30 0.03
Step by Step Solution
There are 3 Steps involved in it
1 Expert Approved Answer
Step: 1 Unlock

Question Has Been Solved by an Expert!
Get step-by-step solutions from verified subject matter experts
Step: 2 Unlock
Step: 3 Unlock