

Question: Suppose the graph below represents the demand and supply for cotton wool at various prices, answer the question that follow: Price (AUD) Cam 6
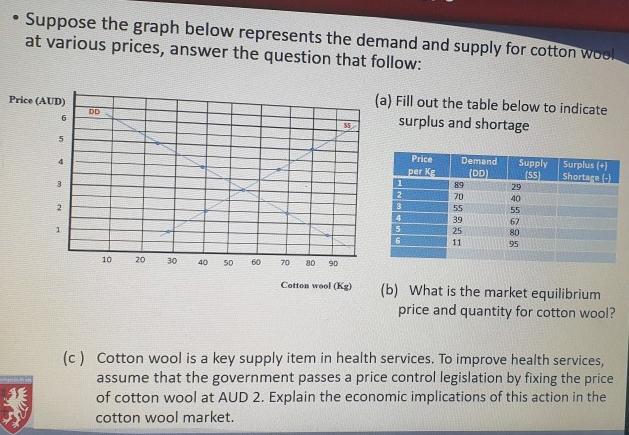
Suppose the graph below represents the demand and supply for cotton wool at various prices, answer the question that follow: Price (AUD) Cam 6 5 4 3 2 1 DD 10 20 30 40 50 60 70 80 90 Cotton wool (Kg) (a) Fill out the table below to indicate surplus and shortage Price per Ke Demand (DD) 123456 BRAASE 89 70 55 39 25 11 Supply Surplus (+) (SS) Shortage (-) 40 80 (b) What is the market equilibrium price and quantity for cotton wool? (c) Cotton wool is a key supply item in health services. To improve health services, assume that the government passes a price control legislation by fixing the price of cotton wool at AUD 2. Explain the economic implications of this action in the cotton wool market.
Step by Step Solution
3.44 Rating (163 Votes )
There are 3 Steps involved in it
a Pricevg 1 2 3 4 5 6 9 Due to the price fixing the equilibrium will be shifted towards the left An... View full answer

Get step-by-step solutions from verified subject matter experts