

Question: Suppose we want to solve an optimization problem with two constraints graphically. We graphed both constraints and identified the feasible region, it's shown in yellow
Suppose we want to solve an optimization problem with two constraints graphically. We graphed both constraints and identified the feasible region, it's shown in yellow below. The slope of the profit maximization objective function is shown by the dashed line. What is the solution to this problem? Good B 16 14 12 10 80 6 4 2 0 0 4 10 20 30 Good A Constraint 1 Constraint 2 40 (0,12.4) (63, 0) (3.9, 11.7) (3.1, 8.2) The problem is infeasible, no solution 50 60 70
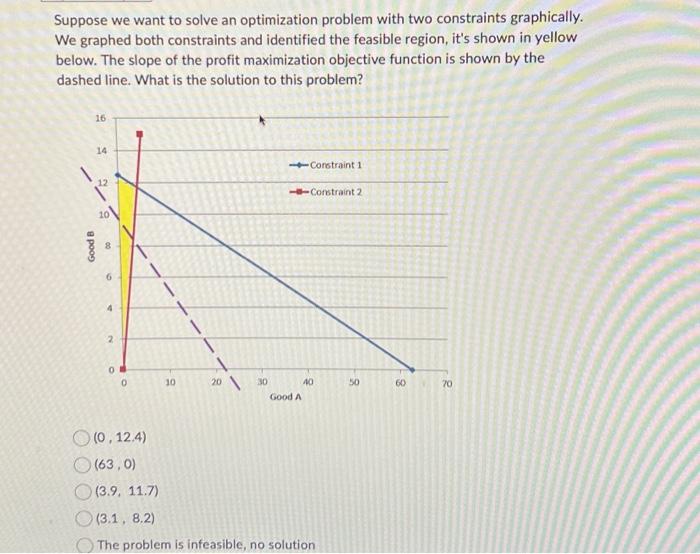
Suppose we want to solve an optimization problem with two constraints graphically. We graphed both constraints and identified the feasible region, it's shown in yellow below. The slope of the profit maximization objective function is shown by the dashed line. What is the solution to this problem? (0,12.4) (63,0) (3.9,11.7) (3.1,8.2)
Step by Step Solution
There are 3 Steps involved in it
1 Expert Approved Answer
Step: 1 Unlock

Question Has Been Solved by an Expert!
Get step-by-step solutions from verified subject matter experts
Step: 2 Unlock
Step: 3 Unlock