

Question: Suppose you ran a cluster analysis using hierarchical clustering algorithm on a product's preferences. The analysis produced the dendrogram and a table of cluster size
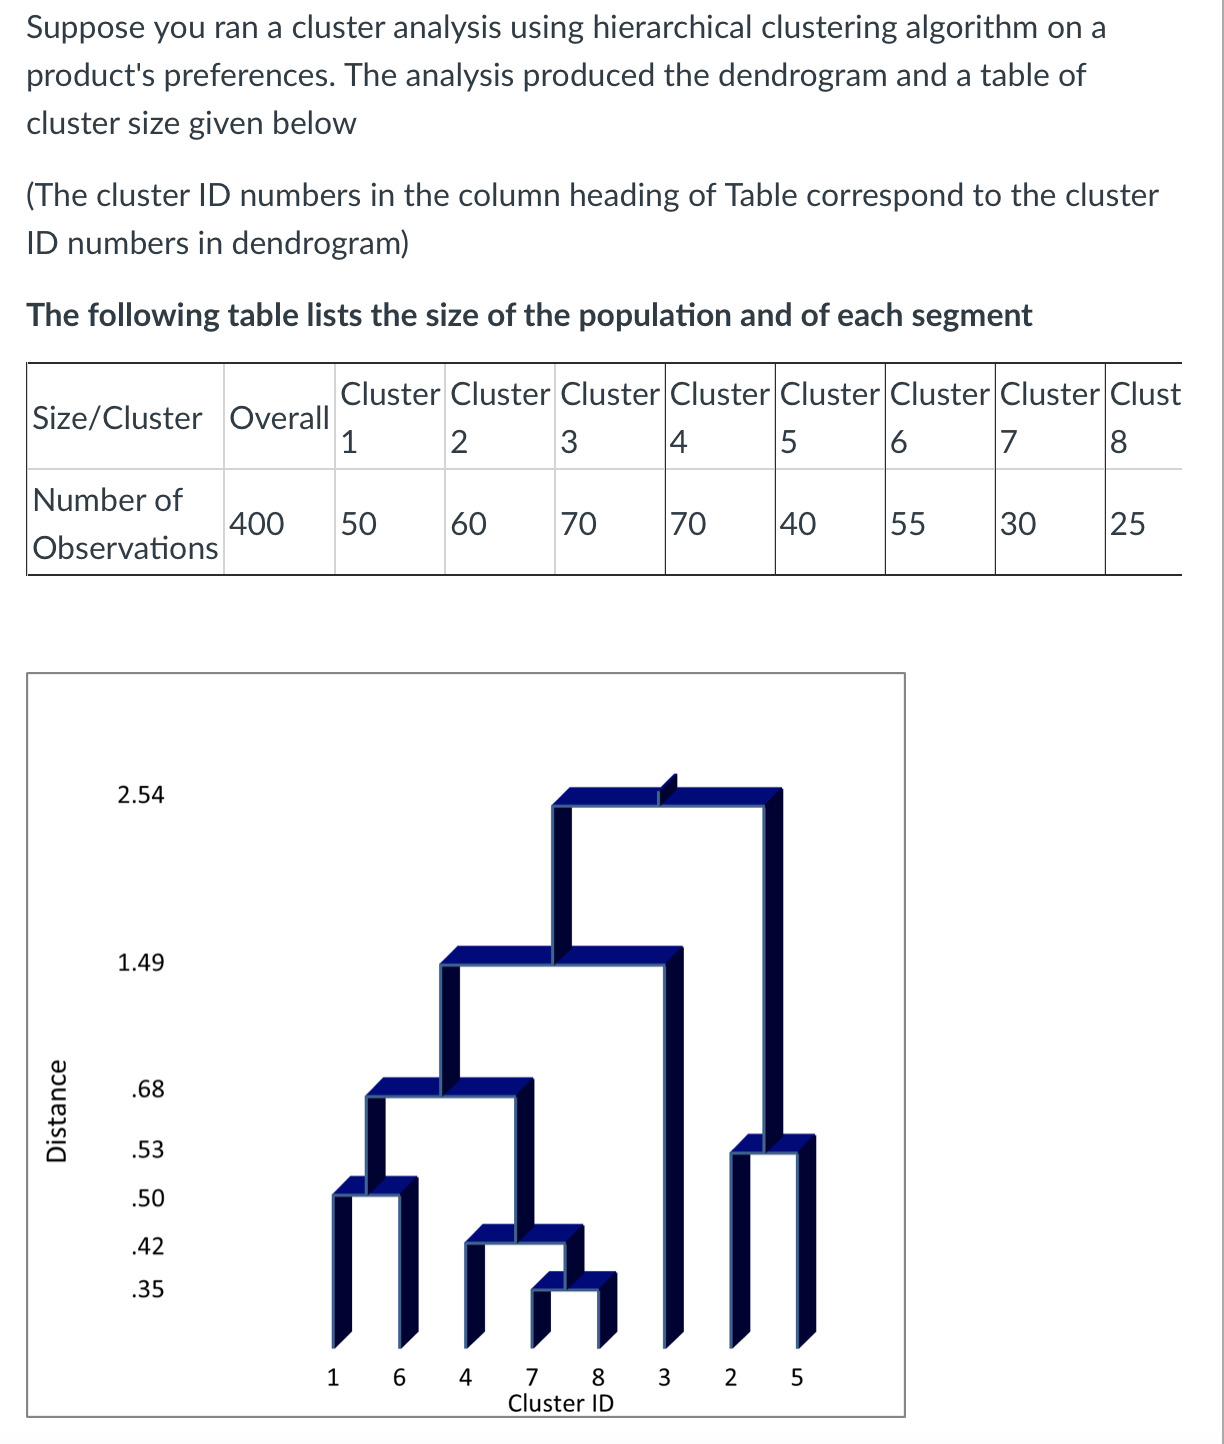
Suppose you ran a cluster analysis using hierarchical clustering algorithm on a product's preferences. The analysis produced the dendrogram and a table of cluster size given below (The cluster ID numbers in the column heading of Table correspond to the cluster ID numbers in dendrogram) The following table lists the size of the population and of each segment _ Cluster Cluster Cluster Cluster Cluster Cluster Cluster Clust Size/Cluster Overall 1 2 3 4 5 6 7 8 Number of . 400 50 60 70 70 40 55 30 25 Observations cu u c 53 .2 D 7 8 Cluster ID
Step by Step Solution
There are 3 Steps involved in it
1 Expert Approved Answer
Step: 1 Unlock

Question Has Been Solved by an Expert!
Get step-by-step solutions from verified subject matter experts
Step: 2 Unlock
Step: 3 Unlock