

Question: Suppose z is the standard normal variable. Draw the normal curve for each of the following probability statements to visualize the required area and determine
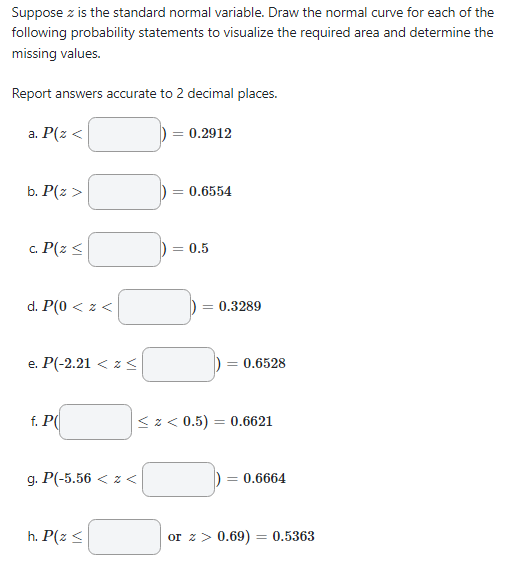
Suppose z is the standard normal variable. Draw the normal curve for each of the following probability statements to visualize the required area and determine the missing values. Report answers aoourate to 2 decimal plaoes. a. Hz .1 D] = {1.2912 b. 131:: p C} = l}.554 o. P(z 5 S] = {1.5 :1. PH} 1: z <:: c e. a: z asses f. a as b.6521 g. p s: :1 h. g or day>
Step by Step Solution
There are 3 Steps involved in it
1 Expert Approved Answer
Step: 1 Unlock

Question Has Been Solved by an Expert!
Get step-by-step solutions from verified subject matter experts
Step: 2 Unlock
Step: 3 Unlock