

Question: Table 1 2 . 4 Arithmetic Average Annual Returns and Standard Deviation by Asset Class, 1 9 8 1 2 0 2 0 ( source:
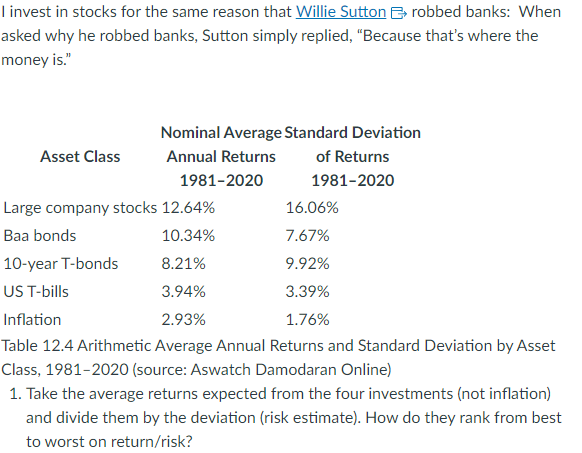
Table Arithmetic Average Annual Returns and Standard Deviation by Asset Class, source: Aswatch Damodaran Online
Take the average returns expected from the four investments not inflation and divide them by the deviation risk estimate How do they rank from best to worst on returnrisk
Step by Step Solution
There are 3 Steps involved in it
1 Expert Approved Answer
Step: 1 Unlock

Question Has Been Solved by an Expert!
Get step-by-step solutions from verified subject matter experts
Step: 2 Unlock
Step: 3 Unlock