

Question: Table 1 below is the baseline characteristics table for the Oxford vaccine Phase III trials. COVO02 (UK; LD/SD; N-2741) COV002 (UK; SD/SD; N-4807) COvoo3 (Brazil;

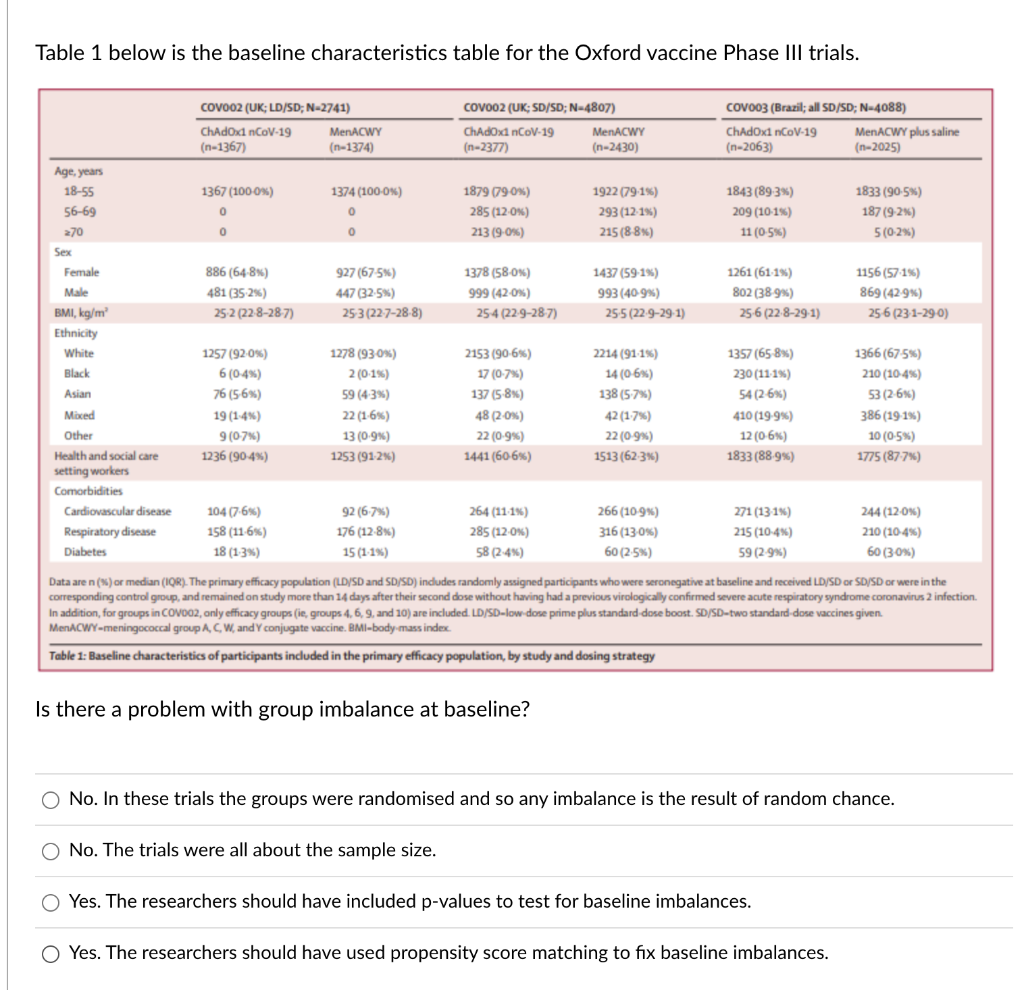
Table 1 below is the baseline characteristics table for the Oxford vaccine Phase III trials. COVO02 (UK; LD/SD; N-2741) COV002 (UK; SD/SD; N-4807) COvoo3 (Brazil; all SD/SD; N-4088) ChAdOx1 nCoV-19 MenACWY ChAdox1 nCoV-19 MenACWY ChAdOx1 nCoV-19 MenACWY plus saline (n-1367) n-1374) (n-2377) (n-2430) (n-2063) (n-2025) Age, years 18-55 1367 (100-0%) 1374 (100-0%) 1879 (790%) 1922 (79.16) 1843 (89.3%%) 1833 (90.5%) 56-69 285 (12.0%%) 293 (12-1%%) 209 (10-1%) 187 (9-2%6) 270 213 (9-0%) 215 (8-8%) 11 (0-5%) 5 (0-2%) Sex Female 886 (64-8%) 927 (67-5%) 1378 (58-0%) 1437 (59-1%%) 1261 (61-1%%) 1156 (57.1%) Male 481 (35.2%%) 447 (32-5%) 999 (42-0%) 993 (40-9%) 802 (38-9%) 869 (42-9%) BMI, kg/m' 25-2 (22-8-28-7) 25-3 (22-7-28-8) 25-4 (22-9-28-7) 25-5 (22.9-29.1) 25-6 (22.8-29.1) 25-6 (23.1-29-0) Ethnicity White 1257 (92-0%%) 1278 (93-0%) 2153 (90-6%) 2214 (91-1%) 1357 (65-8%) 1366 (67-5%%) Black 6 (0-4%%) 2 (0.1%%) 17 (0-7%) 14 (0-6%) 230 (11-1%%) 210 (10-4%) Asian 76 (5-6%) 59 (4.3%) 137 (5-8%) 138 (5-7%) 54 (2-6%) 53 (2-6%) Mixed 19 (1.4%%) 22 (1-6%%) 48 (2-0%) 42 (1.7%%) 410 (19-9%%) 386 (19-1%%) Other 9 (0-7% ) 13 (0.9%) 22 (0-9%%) 22 (0-9%%) 12 (0-6%) 10 (0-5%) Health and social care 1236 (90-4%) 1253 (91-2%6) 1441 (60-6%) 1513 (62.3%) 1833 (88-9%%) 1775 (87-7%) setting workers Comorbidities Cardiovascular disease 104 (7.6%) 92 (6.7%) 264 (11.1%%) 266 (10-9%) 271 (13-1%%) 244 (12-0%) Respiratory disease 158 (11-6%) 176 (12-8%) 285 (12.0%) 316 (13-0%) 215 (10-4%%) 210 (10-4%%) Diabetes 18 (1-3%) 15 (1-1%) 58 (2-4%) 60 (2.5%) 59 (2-9%) 60 (30%) Data are n (%) or median (IQR). The primary efficacy population (LD/SD and SD/SD) indudes ran and received LD/SD or SD/SD or were in the corresponding control group, and Ion study more than 14 days after their seco tory syndror coronavirus 2 infection. In addition, for groups in COV002, only efficacy groups (ie, group dose boost. SD/SD- e vaccines given. MenACWY-meningococcal group A, C, W, and Y co Table 1: Baseline characteristics of participants included in the primary efficacy population, by study and dosing strategy Is there a problem with group imbalance at baseline? O No. In these trials the groups were randomised and so any imbalance is the result of random chance. O No. The trials were all about the sample size. O Yes. The researchers should have included p-values to test for baseline imbalances. O Yes. The researchers should have used propensity score matching to fix baseline imbalances
Step by Step Solution
There are 3 Steps involved in it

Get step-by-step solutions from verified subject matter experts