

Question: Table 1. Cell potential measurements Table 1. Cell potential measurements Trial 1 Trial 2 Trial 3 Ag-Cu cell (V) 0.303 0.312 0.306 Cu-Fe cell (V)
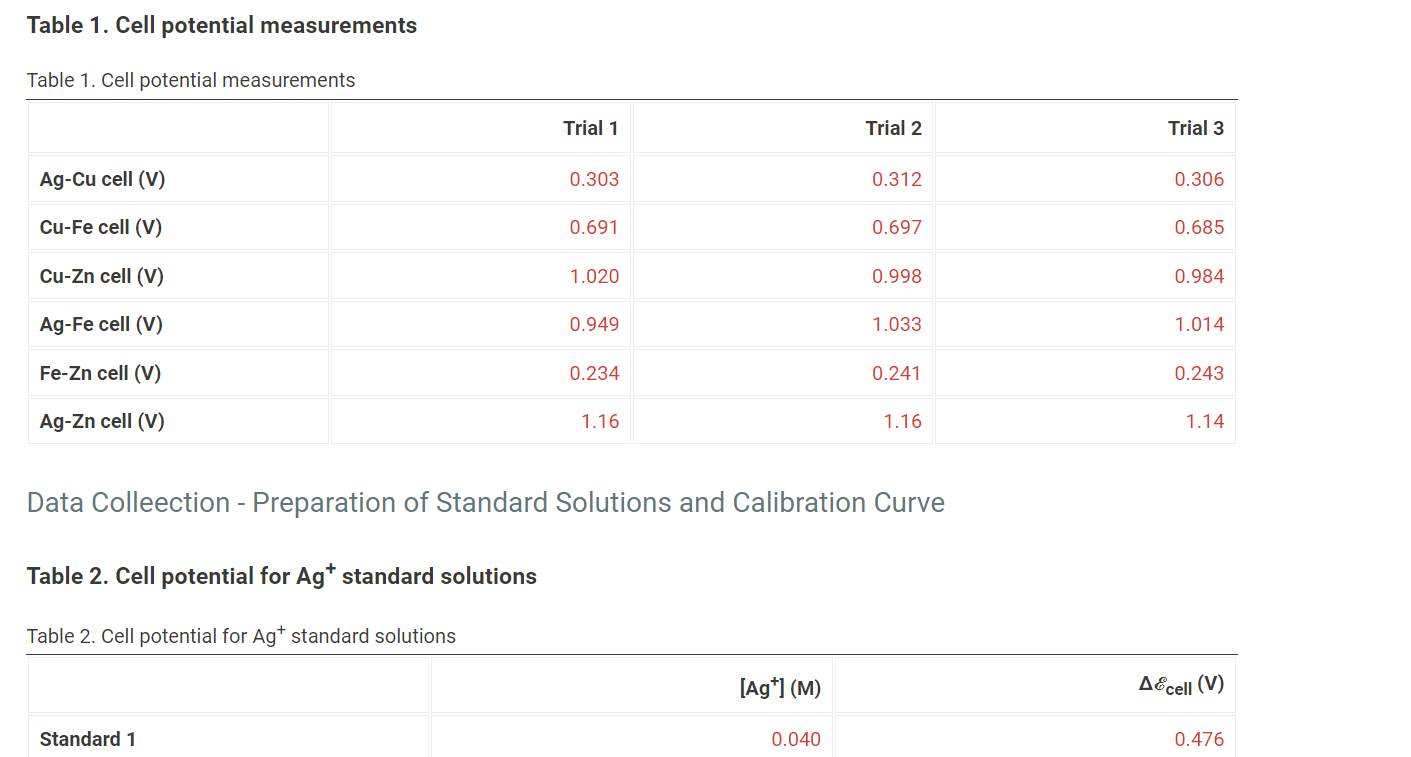
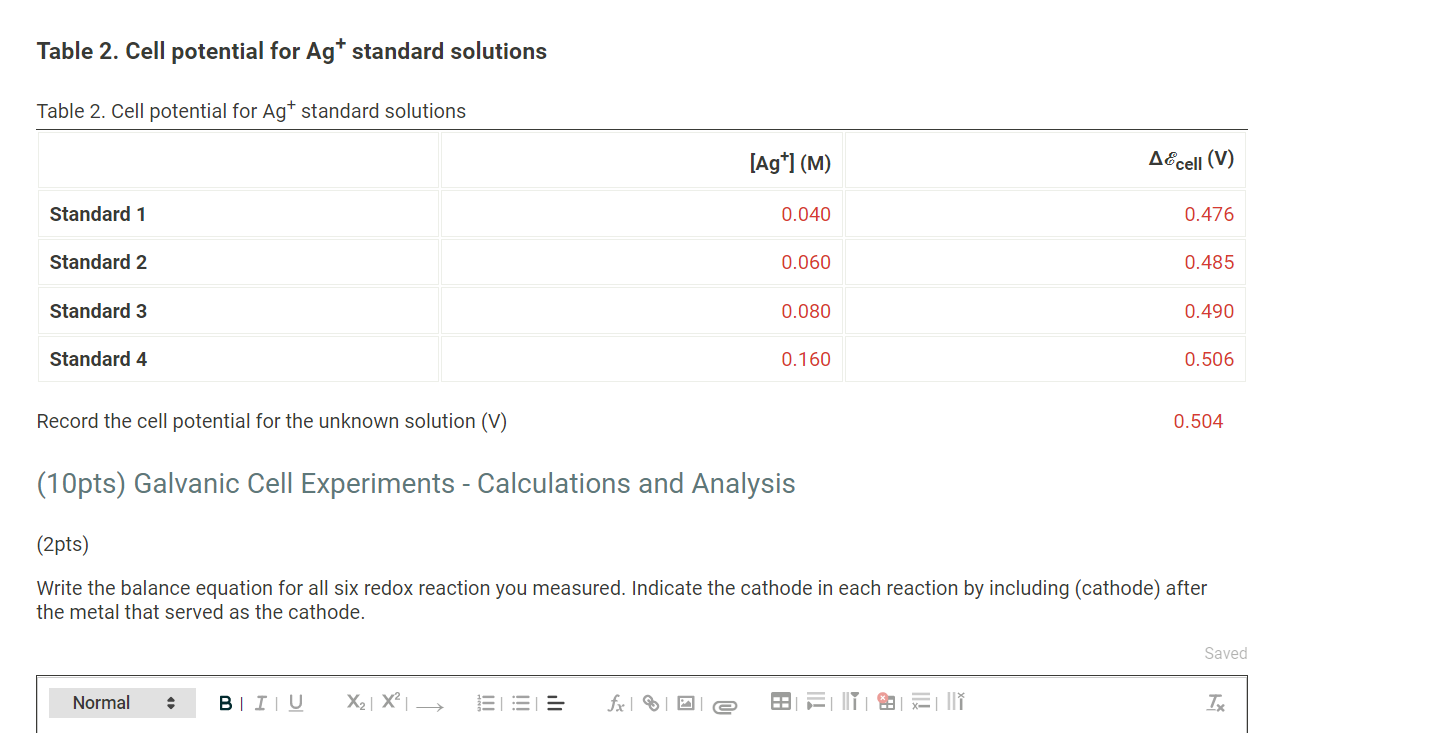
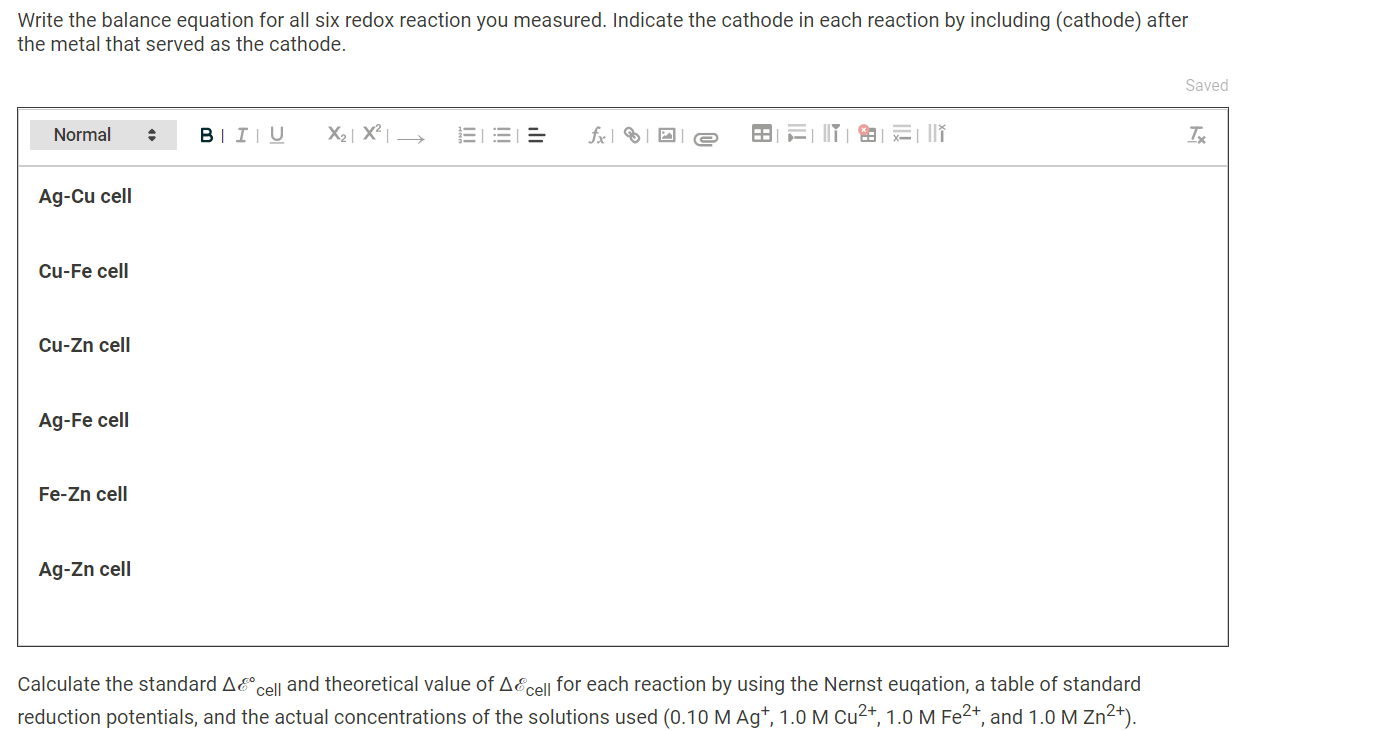
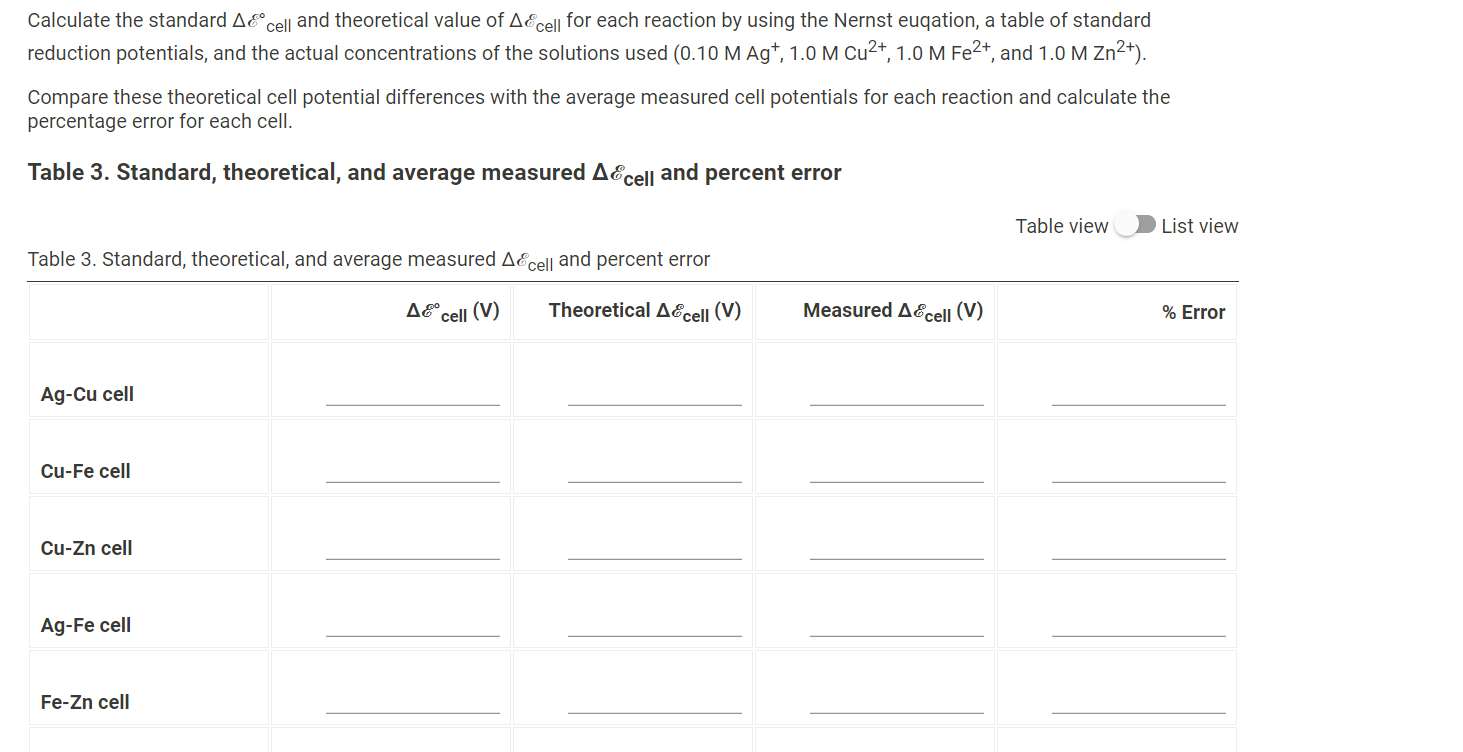
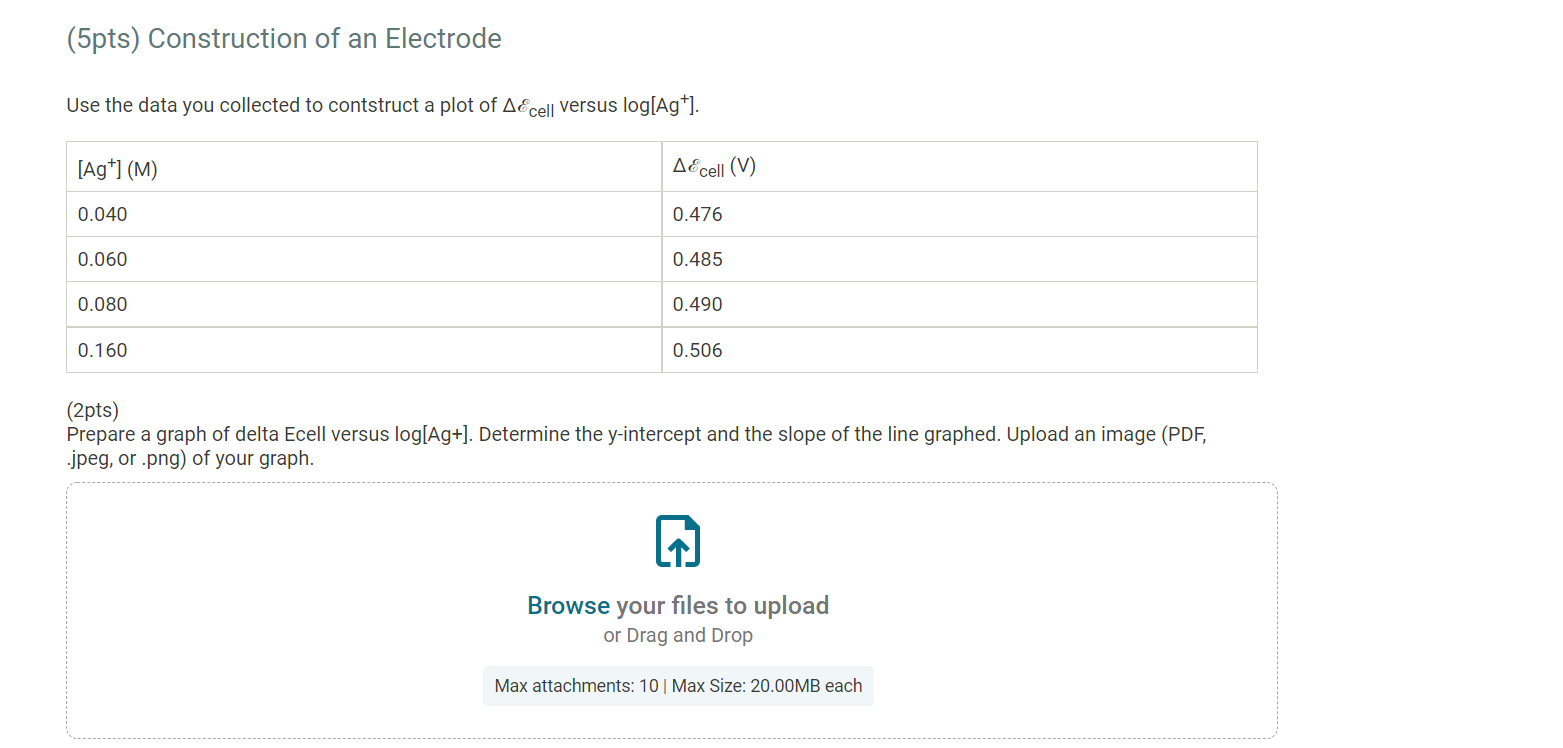
Table 1. Cell potential measurements Table 1. Cell potential measurements Trial 1 Trial 2 Trial 3 Ag-Cu cell (V) 0.303 0.312 0.306 Cu-Fe cell (V) 0.691 0.697 0.685 Cu-Zn cell (V) 1.020 0.998 0.984 Ag-Fe cell (V) 0.949 1.033 1.014 Fe-Zn cell (V) 0.234 0.241 0.243 Ag-Zn cell (V) 1.16 1.16 1.14 Data Colleection - Preparation of Standard Solutions and Calibration Curve Table 2. Cell potential for Agt standard solutions Table 2. Cell potential for Agt standard solutions [Ag+1(M) AEcell (V) Standard 1 0.040 0.476 Table 2. Cell potential for Agt standard solutions Table 2. Cell potential for Agt standard solutions [Ag+1(M) A&cell (V) Standard 1 0.040 0.476 Standard 2 0.060 0.485 Standard 3 0.080 0.490 Standard 4 0.160 0.506 Record the cell potential for the unknown solution (V) 0.504 (10pts) Galvanic Cell Experiments - Calculations and Analysis - (2pts) Write the balance equation for all six redox reaction you measured. Indicate the cathode in each reaction by including (cathode) after the metal that served as the cathode. Saved Normal BIU X2 X = fx li I TX Write the balance equation for all six redox reaction you measured. Indicate the cathode in each reaction by including (cathode) after the metal that served as the cathode. Saved Normal BIU X2 X III = fox e T Ag-Cu cell Cu-Fe cell Cu-Zn cell Ag-Fe cell Fe-Zn cell Ag-Zn cell Calculate the standard AE cell and theoretical value of AE cell for each reaction by using the Nernst euqation, a table of standard reduction potentials, and the actual concentrations of the solutions used (0.10 M Ag+, 1.0 M Cu2+, 1.0 M Fe2+, and 1.0 M Zn2+). Calculate the standard AE cell and theoretical value of AE cell for each reaction by using the Nernst euqation, a table of standard reduction potentials, and the actual concentrations of the solutions used (0.10 M Ag+, 1.0 M Cu2+, 1.0 M Fe2+, and 1.0 M Zn2+). Compare these theoretical cell potential differences with the average measured cell potentials for each reaction and calculate the percentage error for each cell. Table 3. Standard, theoretical, and average measured Ecell and percent error Table view List view Table 3. Standard, theoretical, and average measured AE cell and percent error Accell (V) Theoretical AEcell (V) Measured AEcell (V) % Error Ag-Cu cell Cu-Fe cell Cu-Zn cell Ag-Fe cell Fe-Zn cell (1pts) Compare the theoretical and measured cell potentials. Comment on possible sources of error in the experiment. Normal BI IU X2 X = for x=||| TX (1 pts) For one pairing that initially gave you a negative voltage reading, write the redox equation, identify the anode and cathode, and give the direction of flow of electricity in the external circuit. Normal X2 X - = fx 18 III TX (1 pts) What is the purpose of the KNO3 salt bridge? Normal BIU X2] X2 E = for IT XY TX ! What is the purpose of the KNO3 salt bridge? Normal a BIU X2 X = fiel III TX (1 pts) A galvanic cell cannot generate electricity forever. List two chemical reactions you can think of for why a galvanic cell may go "dead." Normal . X2 X ESI = fx e IIIIII T (1 pts) Order the four metals from the one that makes the best cathode to the one that is the worst. Normal BIU X2 X fr NY TX (3pts) Construction of Batteries (3pts) Upload an image (PDF, .jpeg, .png) of your labeled drawing of your team's connected batteries and the AE cell: Order the four metals from the one that makes the best cathode to the one that is the worst. Normal BIU X2 X = for M Tx (3pts) Construction of Batteries (3pts) Upload an image (PDF, .jpeg, .png) of your labeled drawing of your team's connected batteries and the AEcell- Browse your files to upload or Drag and Drop Max attachments: 10 Max Size: 20.00MB each (5pts) Construction of an Electrode Use the data you collected to contstruct a plot of AEcell versus log[Ag"). (5pts) Construction of an Electrode Use the data you collected to contstruct a plot of AE cell versus log[Ag+). [Ag+1 (M) AEcell (V) 0.040 0.476 0.060 0.485 0.080 0.490 0.160 0.506 (2pts) Prepare a graph of delta Ecell versus log[Ag+). Determine the y-intercept and the slope of the line graphed. Upload an image (PDF, .jpeg, or.png) of your graph. Browse your files to upload or Drag and Drop Max attachments: 10 Max Size: 20.00MB each (0.25pts) Enter the slope of the trendline from your plot. (0.25pts) Enter the y-intercept of the trendline from your plot. (1.5pts) The measured AEcell recorded was 0.504 V. Calculate the silver concentration of your unknown solutions from its value of Ecell using the calibration curve equation. (1 pts) Compare the theoretical values for standard AEcell and 0.05916 with the values obtained for the y-intercept and slope from your calibration curve. Normal . X2 X 1 -> fx18 TE REPORT SUMMARY (0.25pts) Enter the siope or the trendline from your plot. (0.25pts) Enter the y-intercept of the trendline from your plot. (1.5pts) The measured AE cell recorded was 0.504 V. Calculate the silver concentration of your unknown solutions from its value of AEcell using the calibration curve equation. (1 pts) Compare the theoretical values for standard AEcell and 0.05916 with the values obtained for the y-intercept and slope from your calibration curve. Normal . BI IU X2 X = = = III T Table 1. Cell potential measurements Table 1. Cell potential measurements Trial 1 Trial 2 Trial 3 Ag-Cu cell (V) 0.303 0.312 0.306 Cu-Fe cell (V) 0.691 0.697 0.685 Cu-Zn cell (V) 1.020 0.998 0.984 Ag-Fe cell (V) 0.949 1.033 1.014 Fe-Zn cell (V) 0.234 0.241 0.243 Ag-Zn cell (V) 1.16 1.16 1.14 Data Colleection - Preparation of Standard Solutions and Calibration Curve Table 2. Cell potential for Agt standard solutions Table 2. Cell potential for Agt standard solutions [Ag+1(M) AEcell (V) Standard 1 0.040 0.476 Table 2. Cell potential for Agt standard solutions Table 2. Cell potential for Agt standard solutions [Ag+1(M) A&cell (V) Standard 1 0.040 0.476 Standard 2 0.060 0.485 Standard 3 0.080 0.490 Standard 4 0.160 0.506 Record the cell potential for the unknown solution (V) 0.504 (10pts) Galvanic Cell Experiments - Calculations and Analysis - (2pts) Write the balance equation for all six redox reaction you measured. Indicate the cathode in each reaction by including (cathode) after the metal that served as the cathode. Saved Normal BIU X2 X = fx li I TX Write the balance equation for all six redox reaction you measured. Indicate the cathode in each reaction by including (cathode) after the metal that served as the cathode. Saved Normal BIU X2 X III = fox e T Ag-Cu cell Cu-Fe cell Cu-Zn cell Ag-Fe cell Fe-Zn cell Ag-Zn cell Calculate the standard AE cell and theoretical value of AE cell for each reaction by using the Nernst euqation, a table of standard reduction potentials, and the actual concentrations of the solutions used (0.10 M Ag+, 1.0 M Cu2+, 1.0 M Fe2+, and 1.0 M Zn2+). Calculate the standard AE cell and theoretical value of AE cell for each reaction by using the Nernst euqation, a table of standard reduction potentials, and the actual concentrations of the solutions used (0.10 M Ag+, 1.0 M Cu2+, 1.0 M Fe2+, and 1.0 M Zn2+). Compare these theoretical cell potential differences with the average measured cell potentials for each reaction and calculate the percentage error for each cell. Table 3. Standard, theoretical, and average measured Ecell and percent error Table view List view Table 3. Standard, theoretical, and average measured AE cell and percent error Accell (V) Theoretical AEcell (V) Measured AEcell (V) % Error Ag-Cu cell Cu-Fe cell Cu-Zn cell Ag-Fe cell Fe-Zn cell (1pts) Compare the theoretical and measured cell potentials. Comment on possible sources of error in the experiment. Normal BI IU X2 X = for x=||| TX (1 pts) For one pairing that initially gave you a negative voltage reading, write the redox equation, identify the anode and cathode, and give the direction of flow of electricity in the external circuit. Normal X2 X - = fx 18 III TX (1 pts) What is the purpose of the KNO3 salt bridge? Normal BIU X2] X2 E = for IT XY TX ! What is the purpose of the KNO3 salt bridge? Normal a BIU X2 X = fiel III TX (1 pts) A galvanic cell cannot generate electricity forever. List two chemical reactions you can think of for why a galvanic cell may go "dead." Normal . X2 X ESI = fx e IIIIII T (1 pts) Order the four metals from the one that makes the best cathode to the one that is the worst. Normal BIU X2 X fr NY TX (3pts) Construction of Batteries (3pts) Upload an image (PDF, .jpeg, .png) of your labeled drawing of your team's connected batteries and the AE cell: Order the four metals from the one that makes the best cathode to the one that is the worst. Normal BIU X2 X = for M Tx (3pts) Construction of Batteries (3pts) Upload an image (PDF, .jpeg, .png) of your labeled drawing of your team's connected batteries and the AEcell- Browse your files to upload or Drag and Drop Max attachments: 10 Max Size: 20.00MB each (5pts) Construction of an Electrode Use the data you collected to contstruct a plot of AEcell versus log[Ag"). (5pts) Construction of an Electrode Use the data you collected to contstruct a plot of AE cell versus log[Ag+). [Ag+1 (M) AEcell (V) 0.040 0.476 0.060 0.485 0.080 0.490 0.160 0.506 (2pts) Prepare a graph of delta Ecell versus log[Ag+). Determine the y-intercept and the slope of the line graphed. Upload an image (PDF, .jpeg, or.png) of your graph. Browse your files to upload or Drag and Drop Max attachments: 10 Max Size: 20.00MB each (0.25pts) Enter the slope of the trendline from your plot. (0.25pts) Enter the y-intercept of the trendline from your plot. (1.5pts) The measured AEcell recorded was 0.504 V. Calculate the silver concentration of your unknown solutions from its value of Ecell using the calibration curve equation. (1 pts) Compare the theoretical values for standard AEcell and 0.05916 with the values obtained for the y-intercept and slope from your calibration curve. Normal . X2 X 1 -> fx18 TE REPORT SUMMARY (0.25pts) Enter the siope or the trendline from your plot. (0.25pts) Enter the y-intercept of the trendline from your plot. (1.5pts) The measured AE cell recorded was 0.504 V. Calculate the silver concentration of your unknown solutions from its value of AEcell using the calibration curve equation. (1 pts) Compare the theoretical values for standard AEcell and 0.05916 with the values obtained for the y-intercept and slope from your calibration curve. Normal . BI IU X2 X = = = III T
Step by Step Solution
There are 3 Steps involved in it

Get step-by-step solutions from verified subject matter experts