

Question: Table 1 Key Valuation Ratios for Top 3 Competitors Shine Brite ChemScape Ultra Clean 24.6 22.8 Price Earnings Price/Book 23.6 7.7 12.1 4.2 2.8 2.9
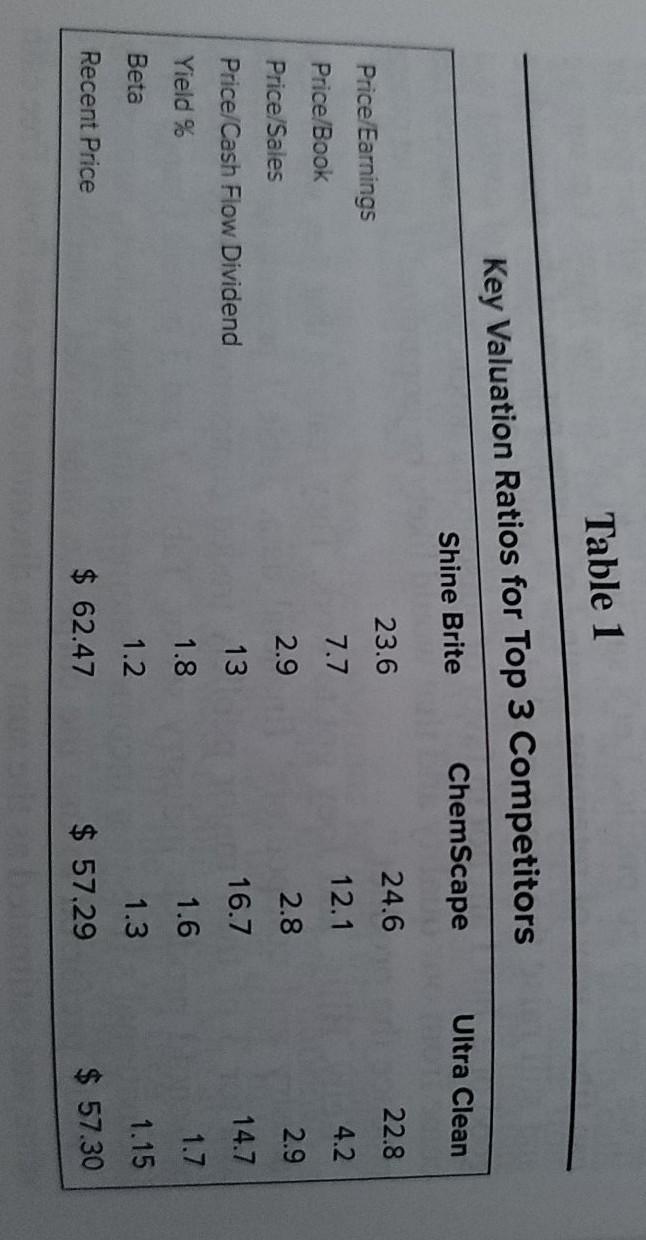
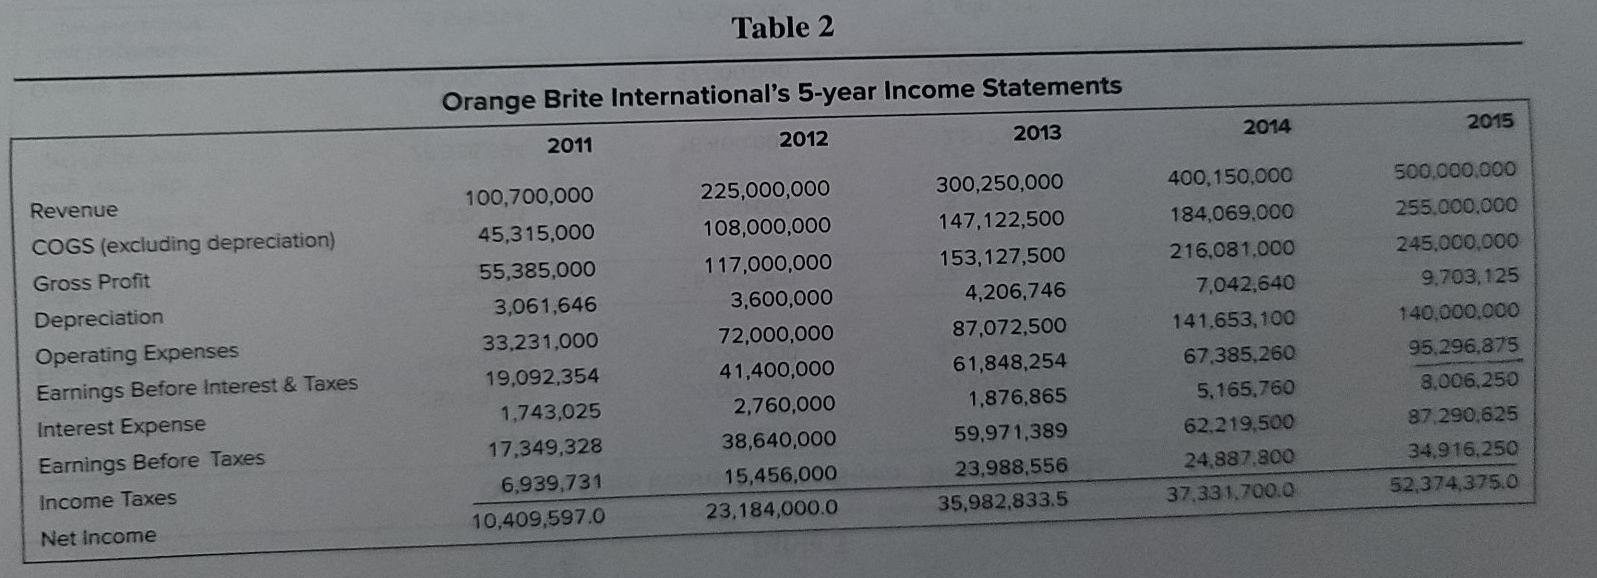
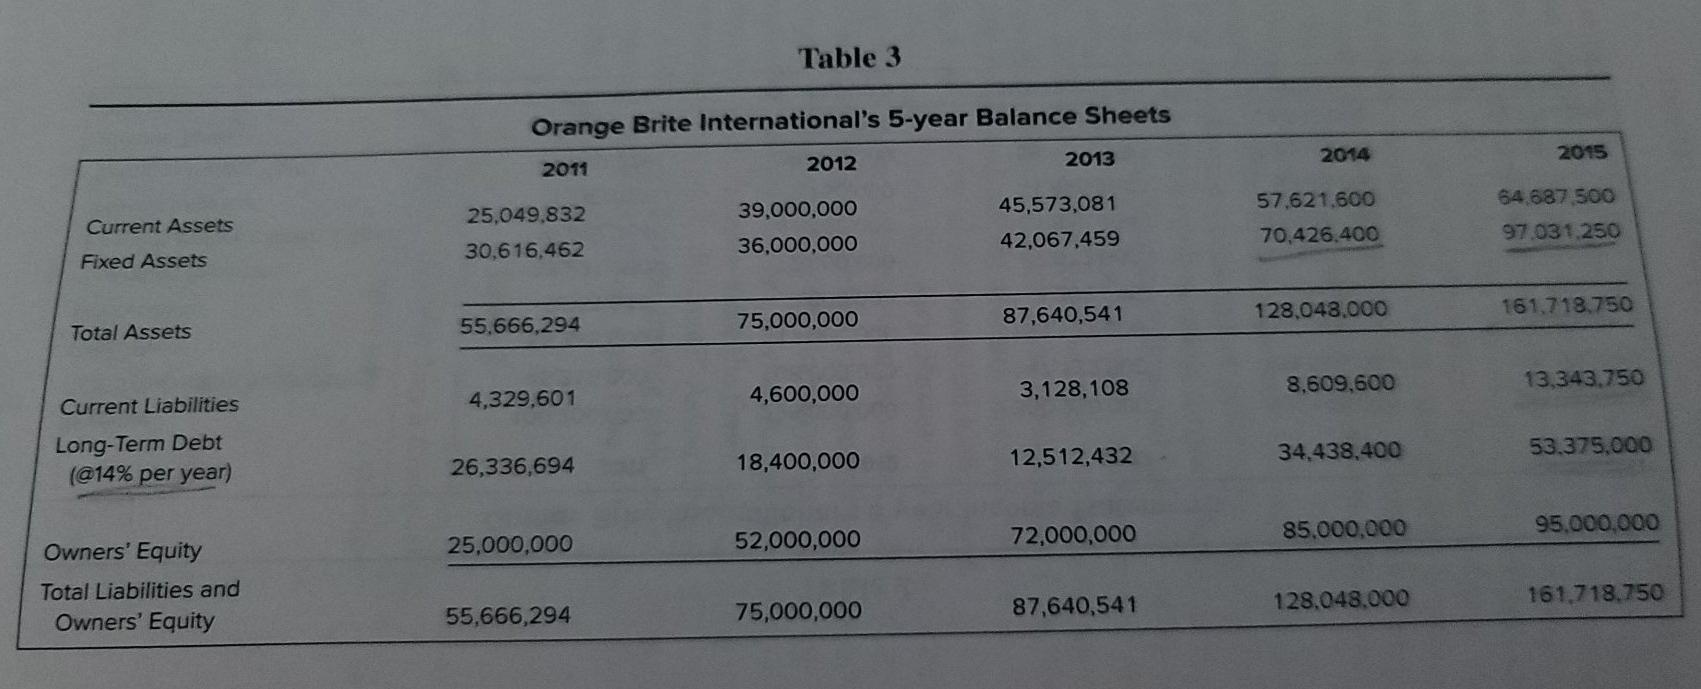
Table 1 Key Valuation Ratios for Top 3 Competitors Shine Brite ChemScape Ultra Clean 24.6 22.8 Price Earnings Price/Book 23.6 7.7 12.1 4.2 2.8 2.9 Price/Sales Price/Cash Flow Dividend 14.7 Yield % 2.9 13 1.8 1.2 $ 62.47 1.7 16.7 1.6 1.3 $ 57.29 Beta 1.15 $ 57.30 Recent Price Table 2 Orange Brite International's 5-year Income Statements 2014 2015 2013 2011 2012 100,700,000 500.000.000 255.000.000 Revenue COGS (excluding depreciation) Gross Profit Depreciation Operating Expenses Earnings Before Interest & Taxes Interest Expense Earnings Before Taxes Income Taxes 225,000,000 108,000,000 117,000,000 3,600,000 72,000,000 41,400,000 2,760,000 38,640,000 15,456,000 23.184,000.0 45,315,000 55,385,000 3,061,646 33.231.000 19,092,354 1,743,025 17,349,328 6.939,731 10,409,597.0 400,150,000 184,069.000 216.081.000 7,042,640 141.653,100 67.385,260 300,250,000 147,122,500 153,127,500 4,206,746 87,072,500 61,848,254 1,876,865 59,971,389 23,988,556 35,982,833.5 245.000.000 9,703,125 140.000.000 95.296.875 8.006,250 87.290.625 34.916.250 52,374,375.0 5,165,760 62.219,500 24,887.800 37.331.700.0 Net Income Table 3 Orange Brite International's 5-year Balance Sheets 2011 2012 2013 2014 2015 25,049.832 30,616.462 Current Assets 39,000,000 36,000,000 45,573,081 42,067,459 57.621.600 70,426.400 64.687.500 97.031.250 Fixed Assets 75,000,000 87,640,541 128.048.000 161.718.750 55.666,294 Total Assets 3,128,108 8,609,600 13,343.750 4,329,601 4,600,000 Current Liabilities Long-Term Debt (@14% per year) 53.375,000 12,512,432 34,438.400 26,336,694 18,400,000 85,000,000 95.000.000 25.000.000 72,000,000 52,000,000 Owners' Equity Total Liabilities and Owners' Equity 128.048.000 161.718.750 55,666,294 87,640,541 75,000,000 5. Based on all three estimates and on the valuation figures for the three competitors, how much per share do you think that Orange Brite is worth? Explain your rationale. Table 1 Key Valuation Ratios for Top 3 Competitors Shine Brite ChemScape Ultra Clean 24.6 22.8 Price Earnings Price/Book 23.6 7.7 12.1 4.2 2.8 2.9 Price/Sales Price/Cash Flow Dividend 14.7 Yield % 2.9 13 1.8 1.2 $ 62.47 1.7 16.7 1.6 1.3 $ 57.29 Beta 1.15 $ 57.30 Recent Price Table 2 Orange Brite International's 5-year Income Statements 2014 2015 2013 2011 2012 100,700,000 500.000.000 255.000.000 Revenue COGS (excluding depreciation) Gross Profit Depreciation Operating Expenses Earnings Before Interest & Taxes Interest Expense Earnings Before Taxes Income Taxes 225,000,000 108,000,000 117,000,000 3,600,000 72,000,000 41,400,000 2,760,000 38,640,000 15,456,000 23.184,000.0 45,315,000 55,385,000 3,061,646 33.231.000 19,092,354 1,743,025 17,349,328 6.939,731 10,409,597.0 400,150,000 184,069.000 216.081.000 7,042,640 141.653,100 67.385,260 300,250,000 147,122,500 153,127,500 4,206,746 87,072,500 61,848,254 1,876,865 59,971,389 23,988,556 35,982,833.5 245.000.000 9,703,125 140.000.000 95.296.875 8.006,250 87.290.625 34.916.250 52,374,375.0 5,165,760 62.219,500 24,887.800 37.331.700.0 Net Income Table 3 Orange Brite International's 5-year Balance Sheets 2011 2012 2013 2014 2015 25,049.832 30,616.462 Current Assets 39,000,000 36,000,000 45,573,081 42,067,459 57.621.600 70,426.400 64.687.500 97.031.250 Fixed Assets 75,000,000 87,640,541 128.048.000 161.718.750 55.666,294 Total Assets 3,128,108 8,609,600 13,343.750 4,329,601 4,600,000 Current Liabilities Long-Term Debt (@14% per year) 53.375,000 12,512,432 34,438.400 26,336,694 18,400,000 85,000,000 95.000.000 25.000.000 72,000,000 52,000,000 Owners' Equity Total Liabilities and Owners' Equity 128.048.000 161.718.750 55,666,294 87,640,541 75,000,000 5. Based on all three estimates and on the valuation figures for the three competitors, how much per share do you think that Orange Brite is worth? Explain your rationale
Step by Step Solution
There are 3 Steps involved in it

Get step-by-step solutions from verified subject matter experts