

Question: Table 1: Option price data for Problem 4.5. Option strike K 0.8 0.9 1.0 1.1 Call option price Put option price Implied volatility 0.000868 0.00838
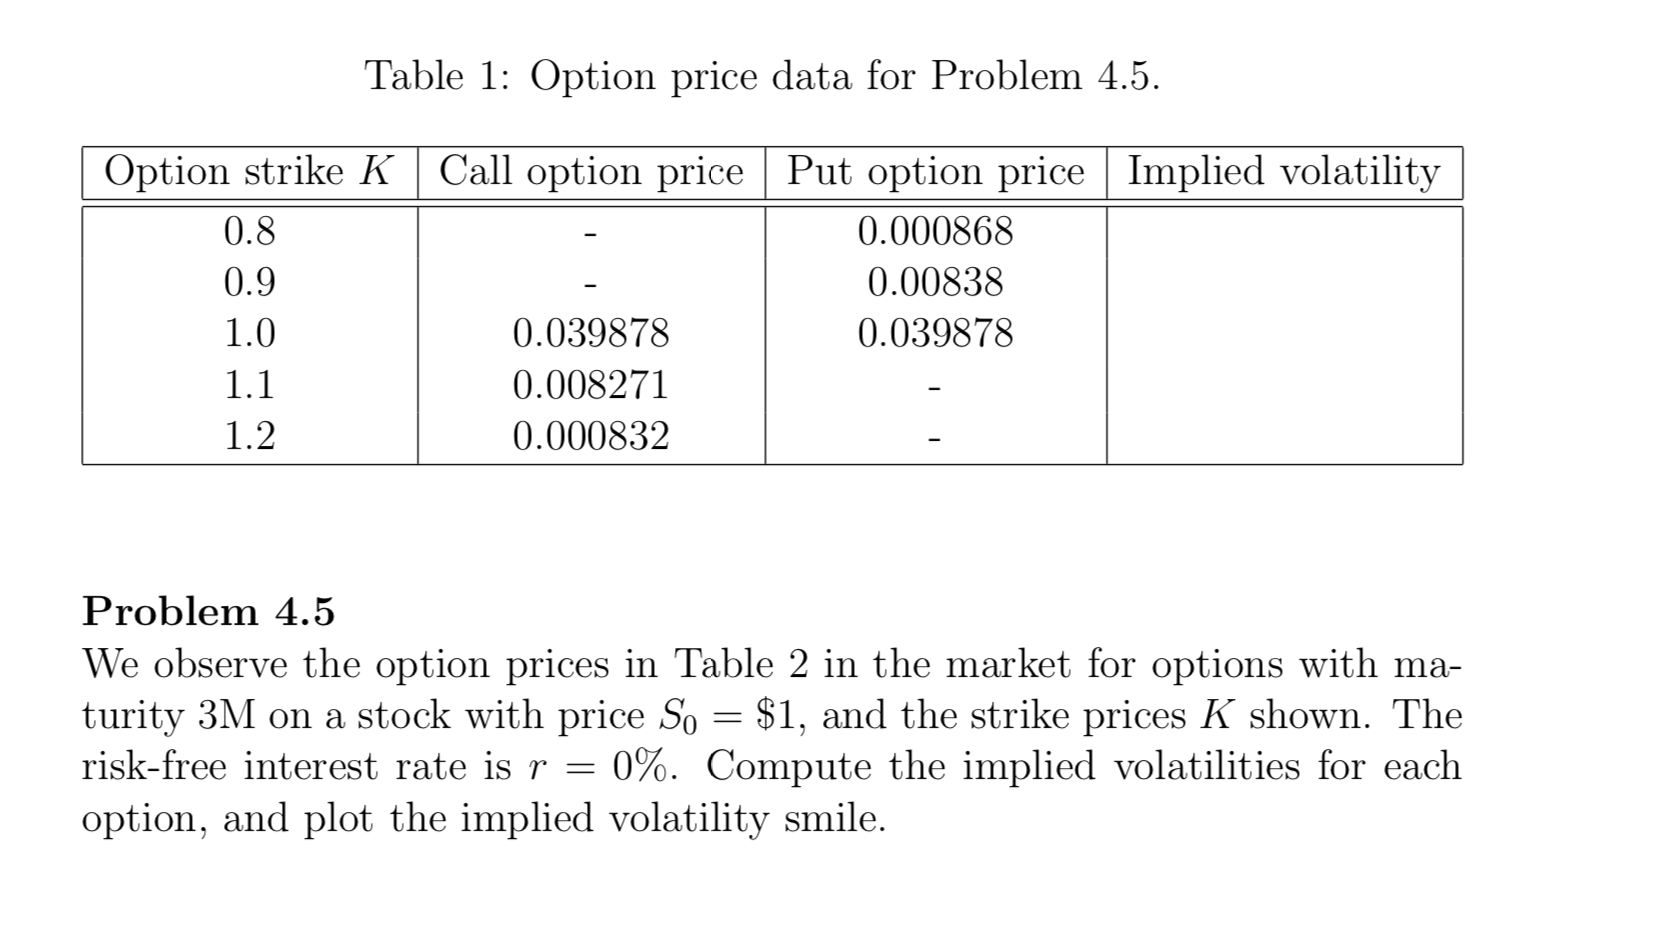
Table 1: Option price data for Problem 4.5. Option strike K 0.8 0.9 1.0 1.1 Call option price Put option price Implied volatility 0.000868 0.00838 0.039878 0.039878 0.008271 0.000832 1.2 Problem 4.5 We observe the option prices in Table 2 in the market for options with ma- turity 3M on a stock with price So = $1, and the strike prices K shown. The risk-free interest rate is r = 0%. Compute the implied volatilities for each option, and plot the implied volatility smile. Table 1: Option price data for Problem 4.5. Option strike K 0.8 0.9 1.0 1.1 Call option price Put option price Implied volatility 0.000868 0.00838 0.039878 0.039878 0.008271 0.000832 1.2 Problem 4.5 We observe the option prices in Table 2 in the market for options with ma- turity 3M on a stock with price So = $1, and the strike prices K shown. The risk-free interest rate is r = 0%. Compute the implied volatilities for each option, and plot the implied volatility smile
Step by Step Solution
There are 3 Steps involved in it

Get step-by-step solutions from verified subject matter experts