

Question: Table 1: Project Description and Task Time Estimates (in Weeks) Table 2: Project Crash Data Suppose that the cost of being late to the market
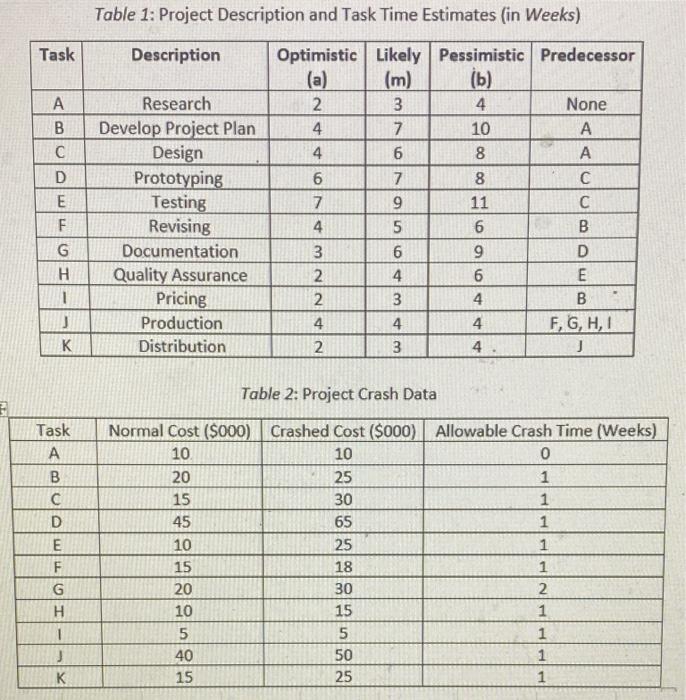
Table 1: Project Description and Task Time Estimates (in Weeks) Table 2: Project Crash Data Suppose that the cost of being late to the market is estimated to be $30,000 per week if the project completion time exceeds 27 weeks. Develop a graph to depict the total cost function of crashing the project. a. Graph should show the direct (normal + any crashing), indirect (late penalties), and total costs for each week in the range between the "Normal" project duration to the "Maximum Crashing" duration. Based on your total cost function developed in the previous question, determine the most "Cost-Effective" project completion time. a. Which task(s) would you recommend crashing to achieve this project completion time and why? b. What is the probability of completing the project in 27 weeks with this project plan
Step by Step Solution
There are 3 Steps involved in it

Get step-by-step solutions from verified subject matter experts