

Question: Table 1: Project Description and Task Time Estimates (in Weeks) Table 2: Project Crash Data Suppose that the cost of being late to the market
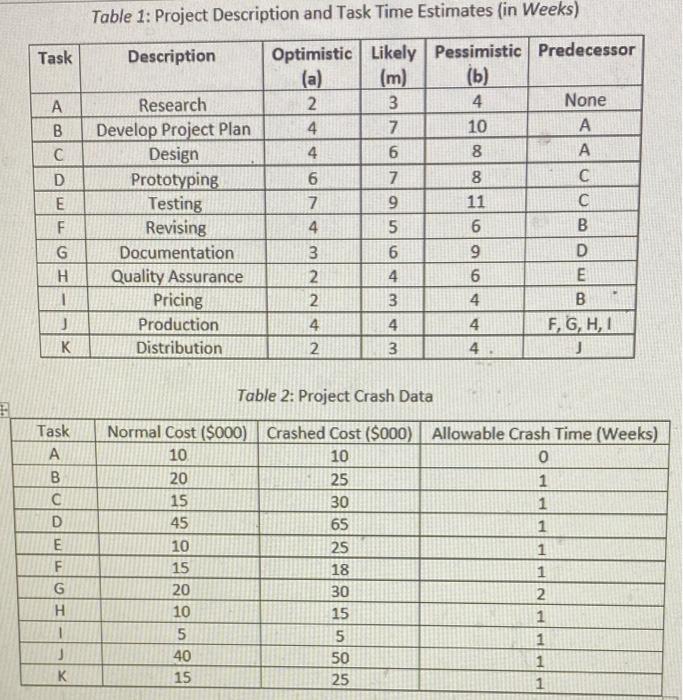
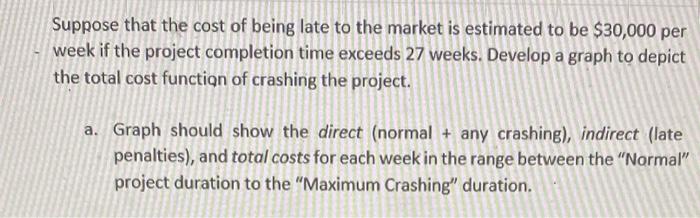
Table 1: Project Description and Task Time Estimates (in Weeks) Table 2: Project Crash Data Suppose that the cost of being late to the market is estimated to be $30,000 per week if the project completion time exceeds 27 weeks. Develop a graph to depict the total cost function of crashing the project. a. Graph should show the direct (normal + any crashing), indirect (late penalties), and total costs for each week in the range between the "Normal" project duration to the "Maximum Crashing" duration
Step by Step Solution
There are 3 Steps involved in it
1 Expert Approved Answer
Step: 1 Unlock

Question Has Been Solved by an Expert!
Get step-by-step solutions from verified subject matter experts
Step: 2 Unlock
Step: 3 Unlock