

Question: Table 1. The Population: Data for 20 individuals (Hypothetical Data) ID # Gender Age Weight Family Offense Type Class Standing Race/Ethnicity (Ibs) Income 1 Male


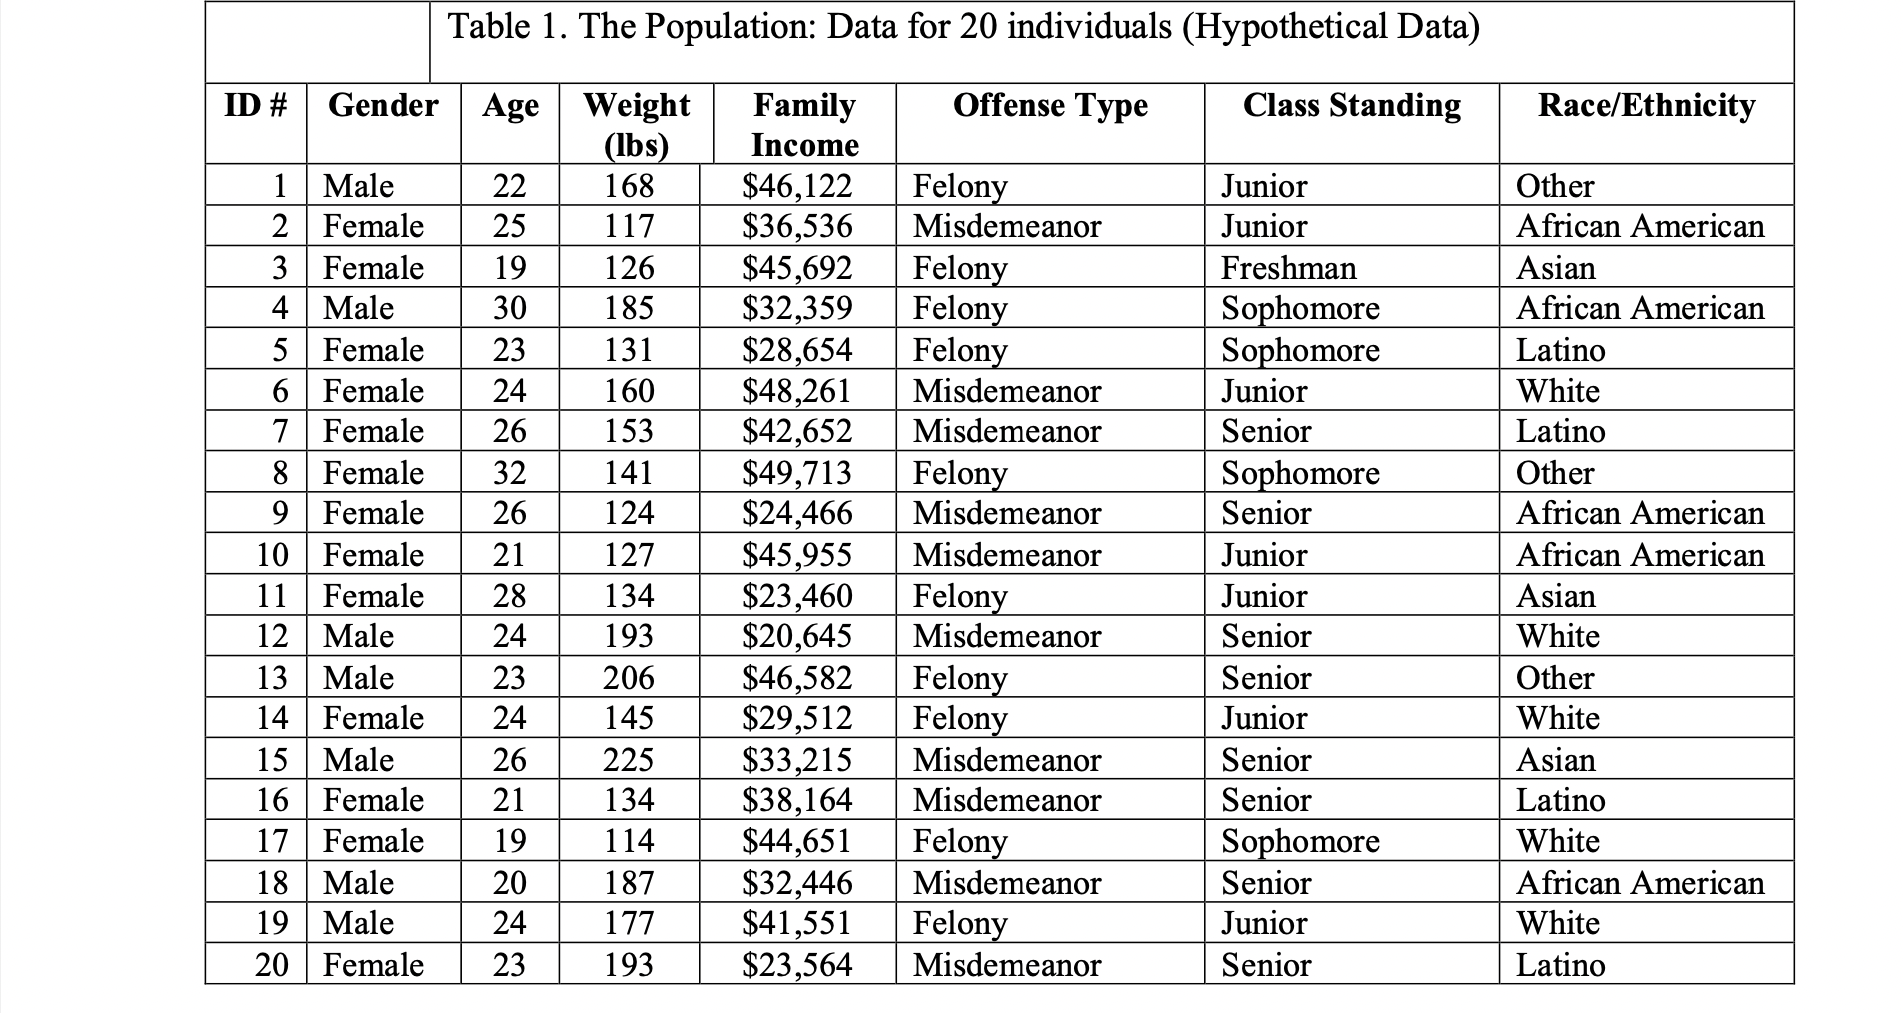
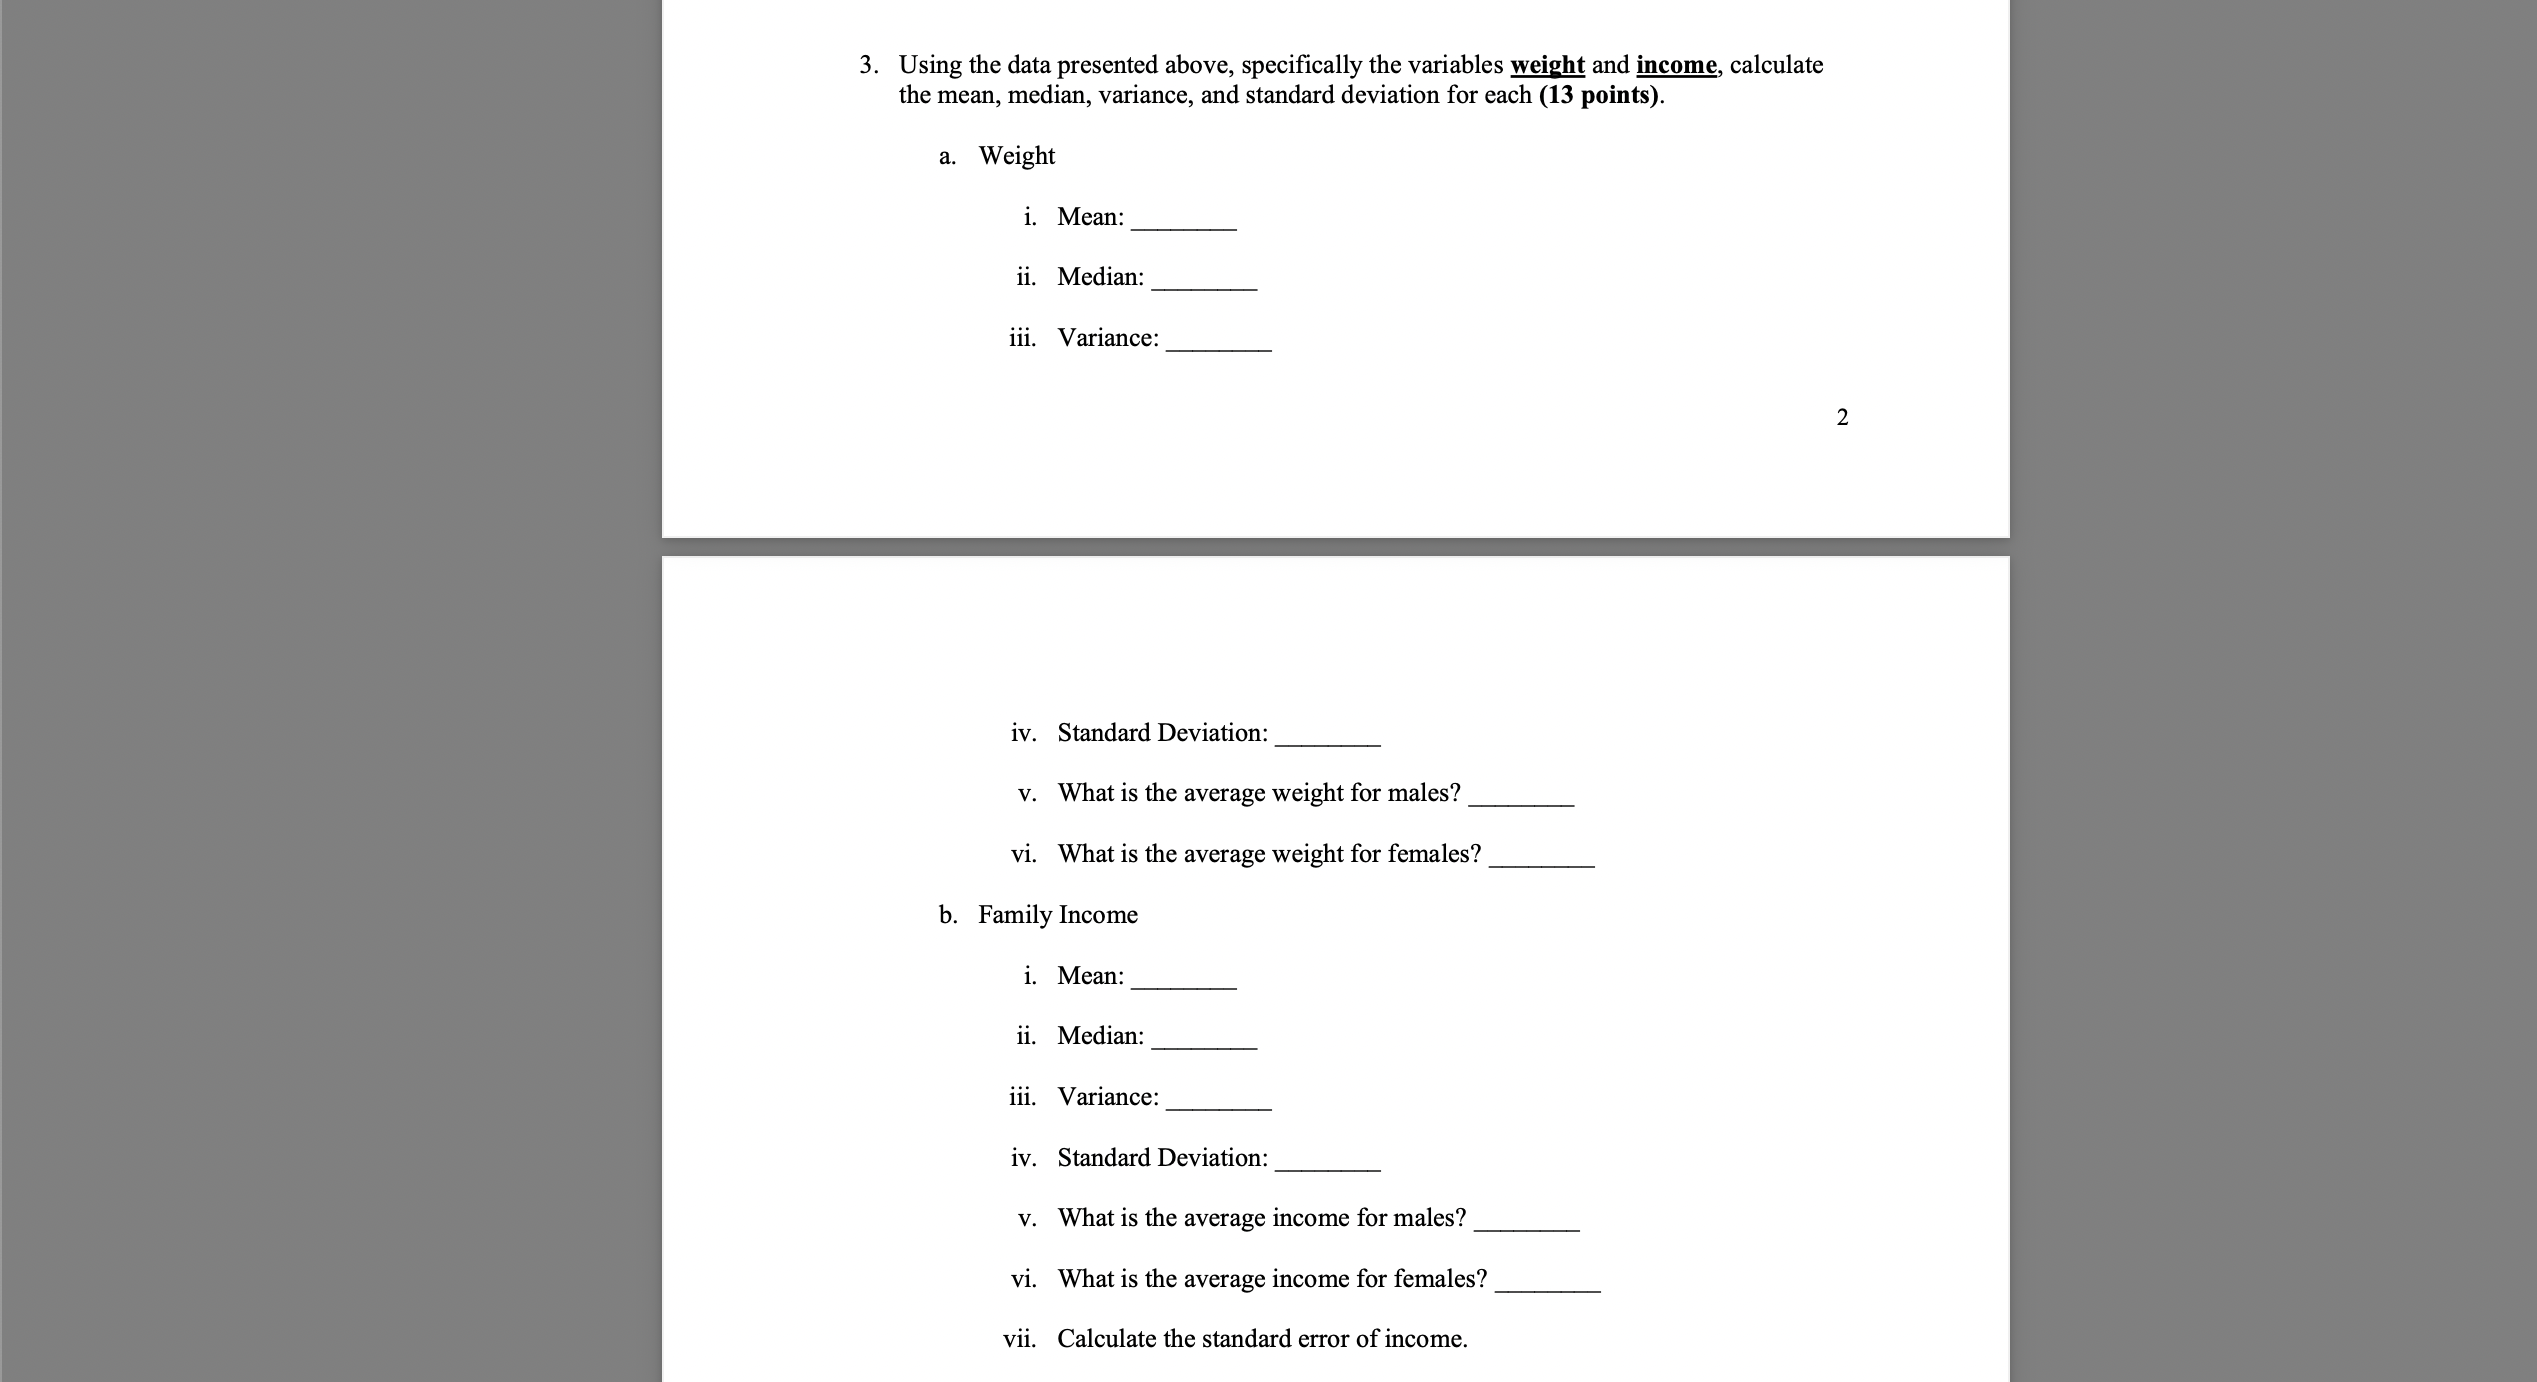
Table 1. The Population: Data for 20 individuals (Hypothetical Data) ID # Gender Age Weight Family Offense Type Class Standing Race/Ethnicity (Ibs) Income 1 Male 22 168 $46,122 Felony Junior Other 2 Female 25 117 $36,536 Misdemeanor Junior African American 3 Female 19 126 $45,692 Felony Freshman Asian Male 30 185 $32,359 Felony Sophomore African American 5 Female 23 131 $28,654 Felony Sophomore Latino 6 Female 24 160 $48,261 Misdemeanor Junior White 7 Female 26 153 $42,652 Misdemeanor Senior Latino 8 Female 32 141 $49,713 Felony Sophomore Other 9 Female 26 124 $24,466 Misdemeanor Senior African American 10 Female 21 127 $45,955 Misdemeanor Junior African American 11 Female 28 134 $23,460 Felony Junior Asian 12 Male 24 193 $20,645 Misdemeanor Senior White 13 Male 23 206 $46,582 Felony Senior Other 14 Female 24 145 $29,512 Felony Junior White 15 Male 26 225 $33,215 Misdemeanor Senior Asian 16 Female 21 134 $38,164 Misdemeanor Senior Latino 17 Female 19 114 $44,651 Felony Sophomore White 18 Male 20 187 $32,446 Misdemeanor Senior African American 19 Male 24 177 $41,551 Felony Junior White 20 Female 23 193 $23,564 Misdemeanor Senior Latino3. Using the data presented above, specically the variables weight and income, calculate the mean, median, variance, and standard deviation for each (13 points). a. Weight i. Mean: ii. Median: iii. Variance: iv. Standard Deviation: v. What is the average weight for males? vi. What is the average weight for females? h. Family Income i. Mean: ii. Median: iii. Variance: iv. Standard Deviation: v. What is the average income for males? vi. What is the average income for females? Calculate the standard error of income
Step by Step Solution
There are 3 Steps involved in it

Get step-by-step solutions from verified subject matter experts