

Question: Table 10.1 presents some data on traffic flows for a link in Salford collected for each of three single hours within a particular time
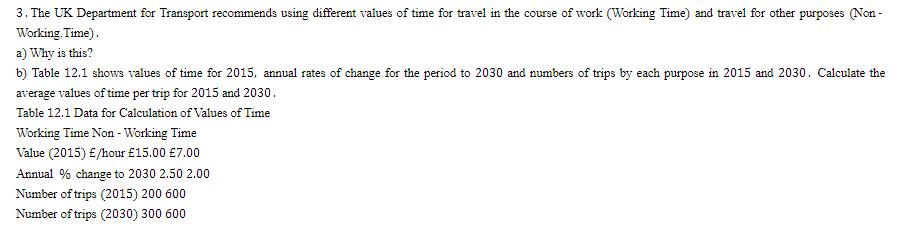
Table 10.1 presents some data on traffic flows for a link in Salford collected for each of three single hours within a particular time period on a working day (Monday to Friday), together with factors to scale the flow for that single hour to the total for the corresponding time period. The link is 1.5 km in length. Table 10.1 Traffic Flow Data Single Hour Flow (Deu/hr) Time - Period Factor Am - Peak (three hours) 1600 3.25 Inter - Peak (six hours) 900 5.50 Pm - Peak (three hours) 1200 2.75 a) Estimate the 12-hour annual average weekday flow on this link. b) Estimate the total number of pcu kilometers on this link in one year. = 2. 1500 persons per hour travel in one direction along a road with two lanes. One lane is for cars and the other for buses. Time - flow functions of the form time. = free-flow time+ (scale x vehicles per hour) are defined separately in Table 11.1 for a car lane and a bus lane. Table 11.1 Time-Flow Functions Free-Flow Time (min) Scale Car Lane 8.00 0.02. Bus Lane 12.00 0.04 The average car occupancy is 1.25 and the average bus occupancy is 20. a) Calculate the overall average travel time per person - trip if 500 persons travel by bus and 1000 travel by car. b) Polly Petrol - Head says that the bus service should be scrapped and both lanes should be available for cars only. Billy Bus - Spotter says that cars should be prohibited from using this road and that one lane should be used by buses only and the other paved over for environmental uses. What would be the outcome oftheir proposals, assuming 1500 persons still travel along this road and average car and bus occupancies remain the same? 3. The UK Department for Transport recommends using different values of time for travel in the course of work (Working Time) and travel for other purposes (Non- Working. Time). a) Why is this? b) Table 12.1 shows values of time for 2015, annual rates of change for the period to 2030 and numbers of trips by each purpose in 2015 and 2030. Calculate the average values of time per trip for 2015 and 2030. Table 12.1 Data for Calculation of Values of Time Working Time Non - Working Time Value (2015) /hour 15.00 7.00 Annual % change to 2030 2.50 2.00 Number of trips (2015) 200 600 Number of trips (2030) 300 600
Step by Step Solution
3.53 Rating (156 Votes )
There are 3 Steps involved in it
Solutions to Transportation Engineering Problems 1 Traffic Flow on Salford Link a 12hour Annual Average Flow Calculate the total flow for each time pe... View full answer

Get step-by-step solutions from verified subject matter experts