

Question: Table 10.16 gives data on the crime rate in 47 states in the United States for 1960. Try to develop a suitable model to explain
Table 10.16 gives data on the crime rate in 47 states in the United States for 1960.
Try to develop a suitable model to explain the crime rate in relation to the 14
socioeconomic variables given in the table. Pay particular attention to the collinearity
problem in developing your model
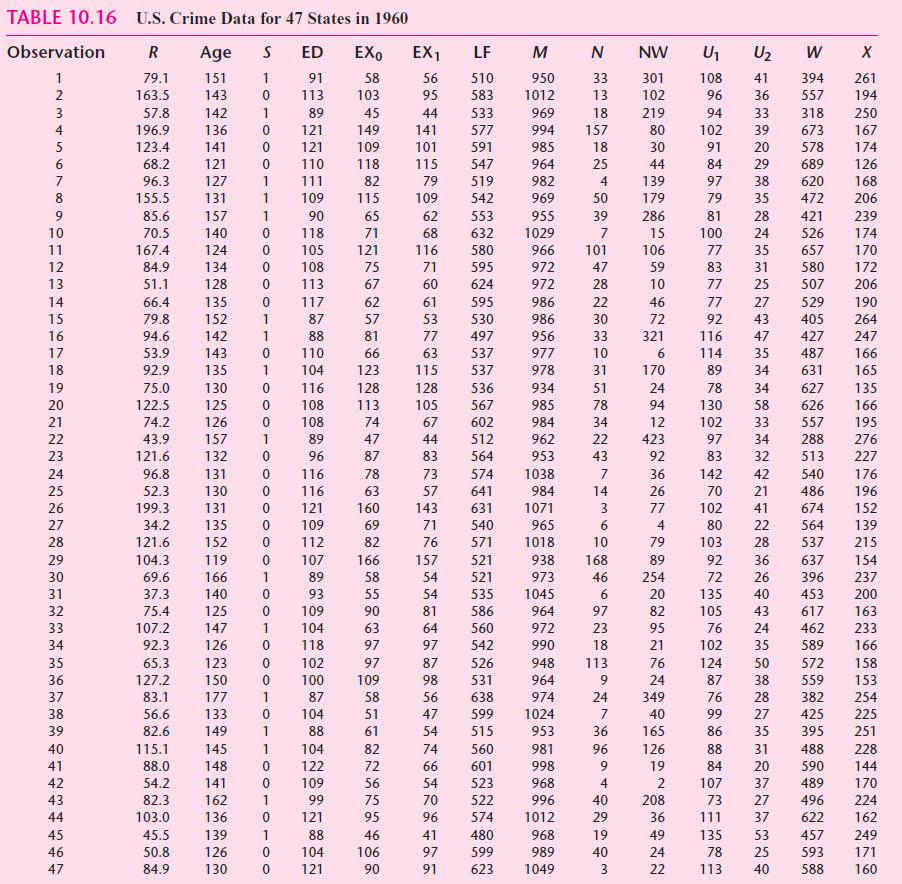
TABLE 10.16 U.S. Crime Data for 47 States in 1960 R Age S EXo 151 1 58 143 0 103 1 45 149 109 118 82 115 65 71 121 75 67 62 57 81 66 123 Observation 1 91106 vasAWN. 2 3 4 5 6 7 8 10 11 12 13 14 15 16 17 18 19 20 21 22 23 24 25 26 27 28 29 30 31 32 33 34 35 36 37 38 39 40 41 42 43 44 45 46 47 79.1 163.5 57.8 196.9 123.4 68.2 96.3 155.5 85.6 70.5 167.4 84.9 51.1 66.4 79.8 94.6 53.9 92.9 75.0 122.5 74.2 43.9 121.6 96.8 52.3 115.1 88.0 54.2 82.3 103.0 142 136 141 45.5 50.8 84.9 121 127 131 157 140 124 134 128 199.3 34.2 121.6 152 104.3 69.6 37.3 75.4 107.2 92.3 65.3 127.2 83.1 56.6 82.6 135 152 142 143 0 135 1 130 0 125 0 0 0 126 0 157 1 132 131 130 131 119 166 140 123 150 1 1 1 90 0 118 135 0 0 177 133 149 105 0 108 0 113 0 117 1 87 1 88 0 107 1 89 0 93 125 0 109 147 1 104 126 0 118 96 0 116 0 116 121 109 112 0 0 1 0 1 ED 91 113 145 148 141 162 1 136 1 0 0 89 121 121 110 111 109 0 139 1 126 130 0 110 104 116 108 108 89 102 100 87 104 88 104 122 109 99 121 88 104 121 128 113 74 47 87 78 63 160 69 82 166 58 55 90 63 97 97 109 58 51 61 82 72 56 75 95 46 106 90 EX 56 95 44 141 101 115 79 109 62 68 116 71 60 61 53 77 63 115 128 105 67 143 71 76 157 54 54 81 64 97 87 98 56 47 54 74 66 54 70 96 LF M 510 950 583 1012 41 97 91 533 577 591 44 83 73 57 641 547 519 542 553 632 580 595 624 595 530 497 537 537 536 567 602 512 564 574 535 586 560 542 526 531 638 969 994 985 972 972 631 1071 540 965 571 1018 521 938 521 973 1045 964 972 990 480 599 623 986 986 956 977 978 934 985 984 962 953 1038 984 964 982 969 955 1029 966 101 47 28 22 30 33 10 31 948 964 974 599 1024 515 953 560 981 601 998 523 968 522 996 574 1012 z 968 989 1049 N 33 13 18 157 18 25 4 50 39 7 51 78 34 22 43 7 14 3 6 10 168 46 6 97 23 18 113 9 24 7 36 96 9 4 40 29 19 40 3 NW 301 102 219 80 30 44 139 179 286 15 106 59 10 46 72 321 6 170 24 94 12 423 92 36 26 77 4 79 89 254 20 82 95 21 76 24 349 40 165 126 19 2 208 36 49 24 22 U 108 96 94 33 318 39 673 20 578 102 91 84 97 U 41 36 29 38 35 79 81 28 100 24 W & 394 557 689 620 472 421 526 657 580 507 77 35 83 31 77 25 77 27 529 92 43 405 116 47 427 114 35 487 89 34 631 78 34 130 58 102 33 97 34 83 32 88 31 84 107 37 73 27 111 37 135 53 78 25 113 40 627 626 557 288 513 142 42 540 70 21 486 102 41 674 80 22 564 103 28 537 92 36 637 72 26 396 135 40 453 105 43 617 76 24 462 102 589 35 124 50 572 87 38 559 76 28 382 99 86 27 425 35 395 X 261 194 250 167 174 126 168 206 239 174 170 172 206 190 264 247 166 165 135 166 195 276 227 176 196 152 139 215 154 237 200 163 233 166 158 153 254 225 251 228 488 20 590 489 496 622 457 249 593 171 588 160 144 170 224 162
Step by Step Solution
3.36 Rating (149 Votes )
There are 3 Steps involved in it
To develop a model to explain the crime rate R using the given socioeconomic variables we can employ multiple linear regression Heres how you can proc... View full answer

Get step-by-step solutions from verified subject matter experts