

Question: Table 12-11 Categories for depreciation write-off Class 3-year MACRS All property with ADR midpoints of four years or less. Autos and light trucks are excluded
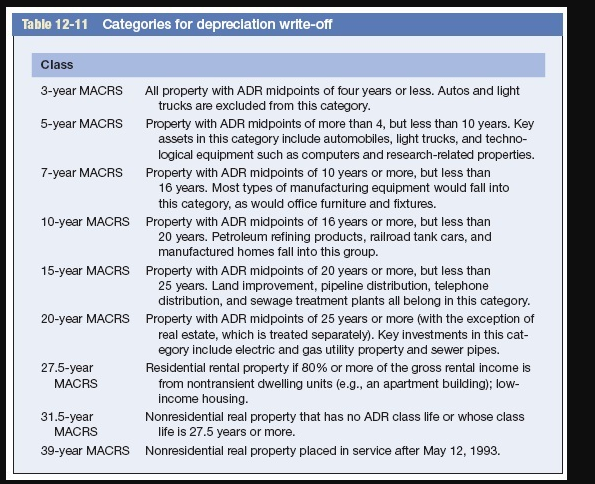
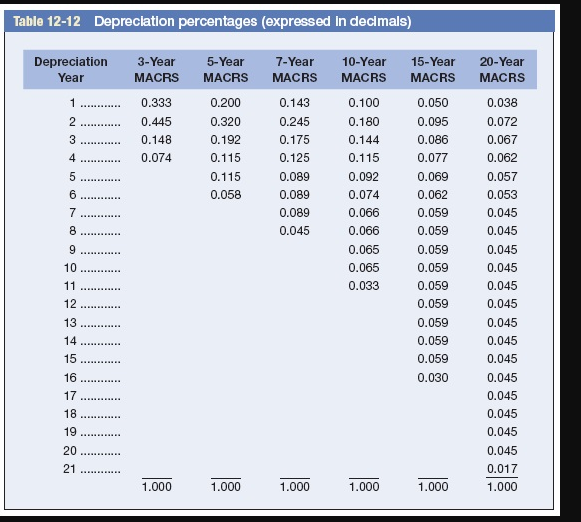
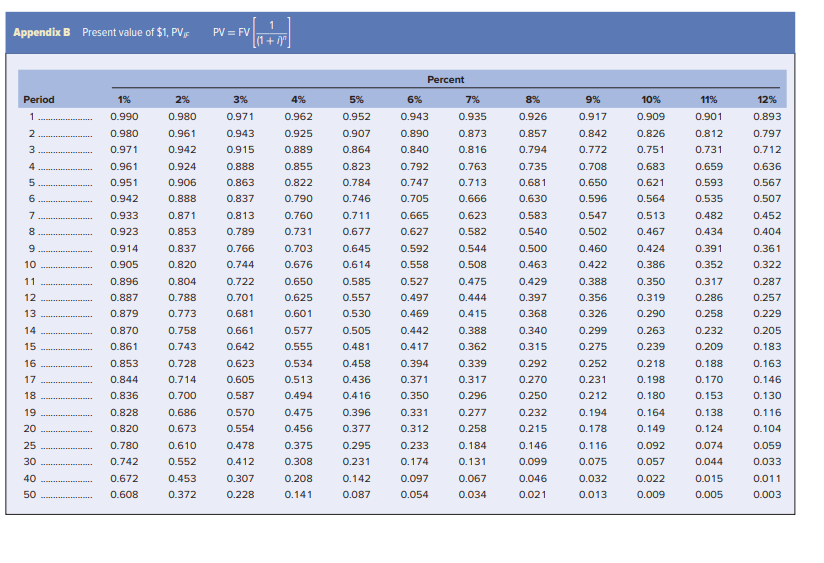
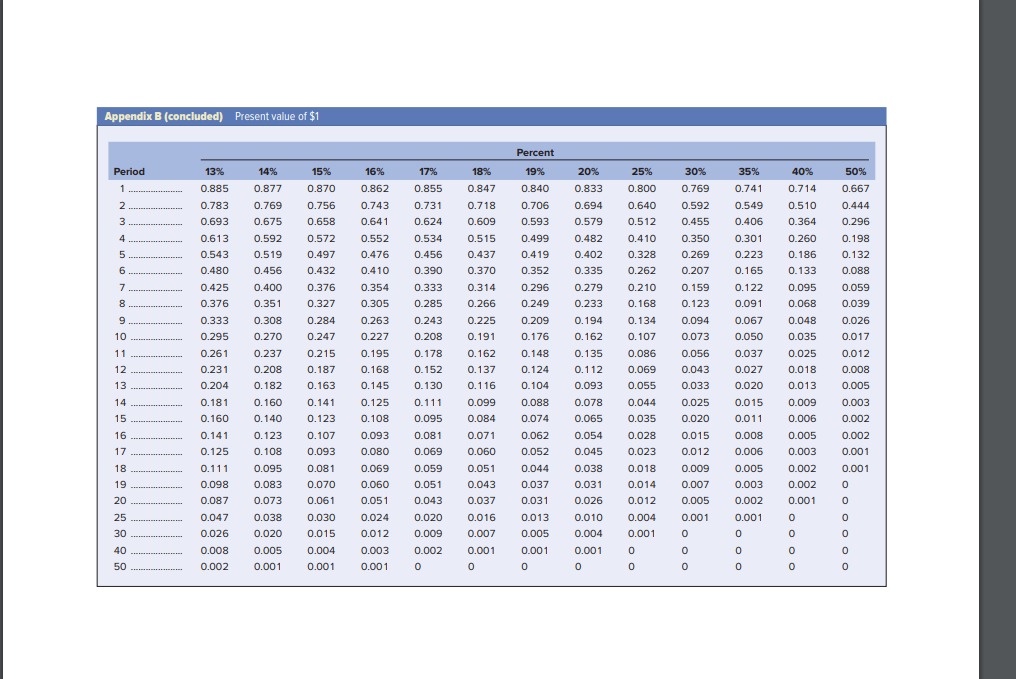
Table 12-11 Categories for depreciation write-off Class 3-year MACRS All property with ADR midpoints of four years or less. Autos and light trucks are excluded from this category. 5-year MACRS Property with ADR midpoints of more than 4, but less than 10 years. Key assets in this category include automobiles, light trucks, and techno- logical equipment such as computers and research-related properties. 7-year MACRS Property with ADR midpoints of 10 years or more, but less than 16 years. Most types of manufacturing equipment would fall into this category, as would office furniture and fixtures. 10-year MACRS Property with ADR midpoints of 16 years or more, but less than 20 years. Petroleum refining products, railroad tank cars, and manufactured homes fall into this group. 15-year MACRS Property with ADR midpoints of 20 years or more, but less than 25 years. Land improvement, pipeline distribution, telephone distribution, and sewage treatment plants all belong in this category. 20-year MACRS Property with ADR midpoints of 25 years or more (with the exception of real estate, which is treated separately). Key investments in this cat- egory include electric and gas utility property and sewer pipes. 27.5-year Residential rental property if 80% or more of the gross rental income is MACRS from nontransient dwelling units (e.g., an apartment building); low- income housing. 31.5-year Nonresidential real property that has no ADR class life or whose class MACRS life is 27.5 years or more. 39-year MACRS Nonresidential real property placed in service after May 12, 1993. Table 12-12 Depreciation percentages (expressed in decimals) 20-Year MACRS Depreciation Year 1 2 3 4 5 6 7 3-Year MACRS 0.333 0.445 0.148 0.074 AN 5-Year MACRS 0.200 0.320 0.192 0.115 0.115 0.058 7-Year MACRS 0.143 0.245 0.175 0.125 0.089 0.089 0.089 LOGO 10-Year MACRS 0.100 0.180 0.144 0.115 0.092 0.074 0.066 0.066 0.065 0.065 0.033 15-Year MACRS 0.050 0.095 0.086 0.077 0.069 0.062 0.059 0.059 0.059 0.059 0.059 0.059 0.059 0.059 0.059 0.030 8 0.045 9 10 11 12 0.038 0.072 0.067 0.062 0.057 0.053 0.045 0.045 0.045 0.045 0.045 0.045 0.045 0.045 0.045 0.045 0.045 0.045 0.045 0.045 0.017 1.000 13 14 15 BER 16 17 18 19 20 21 1.000 1.000 1.000 1.000 1.000 Appendix B Present value of $1, PVR 1 PV = FV [(1+0)"] Percent 2% 3% 4% Period 1 2 9% 0.917 12% 0.893 NM 1% 0.990 0.980 0.971 0.961 0.951 0.942 0.933 0.923 0.962 0.925 0.889 0.855 0.822 0.790 4 5 6 7 5% 0.952 0.907 0.864 0.823 0.784 0.746 0.711 0.677 0.645 0.614 0.585 0.557 0.530 8 9 10 0.980 0.961 0.942 0.924 0.906 0.888 0.871 0.853 0.837 0.820 0.804 0.788 0.773 0.758 0.743 0.728 0.714 0.700 0.686 0.673 0.610 0.552 0.453 0.372 0.914 0.905 0.896 0.887 0.879 0.870 0.861 11 0.971 0.943 0.915 0.888 0.863 0.837 0.813 0.789 0.766 0.744 0.722 0.701 0.681 0.661 0.642 0.623 0.605 0.587 0.570 0.554 0.478 0.412 0.307 0.228 12 13 7% 0.935 0.873 0.816 0.763 0.713 0.666 0.623 0.582 0.544 0.508 0.475 0.444 0.415 0.388 0.362 0.339 0.317 0.296 0.760 0.731 0.703 0.676 0.650 0.625 0.601 0.577 0.555 0.534 0.513 0.494 0.475 0.456 6% 0.943 0.890 0.840 0.792 0.747 0.705 0.665 0.627 0.592 0.558 0.527 0.497 0.469 0.442 0.417 0.394 0.371 0.350 0.331 0.312 0.233 0.174 0.097 0.054 8% 0.926 0.857 0.794 0.735 0.681 0.630 0.583 0.540 0.500 0.463 0.429 0.397 0.368 0.340 0.315 0.292 0.270 0.250 0.232 0.215 0.146 0.099 0.046 0.021 0.842 0.772 0.708 0.650 0.596 0.547 0.502 0.460 0.422 0.388 0.356 0.326 0.299 0.275 0.252 0.231 0.212 0.194 0.178 0.116 0.075 0.032 0.013 10% 0.909 0.826 0.751 0.683 0.621 0.564 0.513 0.467 0.424 0.386 0.350 0.319 0.290 0.263 0.239 0.218 0.198 0.180 0.164 0.149 0.092 0.057 0.022 0.009 0.797 0.712 0.636 0.567 0.507 0.452 0.404 0.361 0.322 0.287 0.257 0.229 0.205 0.183 0.163 0.146 0.130 11% 0.901 0.812 0.731 0.659 0.593 0.535 0.482 0.434 0.391 0.352 0.317 0.286 0.258 0.232 0.209 0.188 0.170 0.153 0.138 0.124 0.074 0.044 0.015 0.005 14 15 16 17 18 19 20 0.853 0.844 0.836 0.828 0.820 0.780 0.742 0.505 0.481 0.458 0.436 0.416 0.396 0.377 0.295 0.231 0.142 0.087 0.277 0.258 25 0.184 0.131 0.116 0.104 0.059 0.033 0.011 0.003 0.375 0.308 0.208 0.141 30 0.672 40 50 0.067 0.034 0.608 Appendix B (concluded) Present value of $1 Percent 13% 16% 18% 50% Period 1 14% 0.877 0.769 19% 0.840 25% 0.800 0.885 2 3 17% 0.855 0.731 0.624 0.534 0.456 0.390 0.333 0.862 0.743 0.641 0.552 0.476 0.410 0.354 9.23 0.305 www 0.847 0.718 0.609 0.515 0.315 0.437 0.370 4. 5 6 0.783 0.693 0.613 0.543 0.480 0.425 0.579 0.376 0.333 0.295 0.261 0.231 0.204 0.181 0.160 7 8 9 9 0.675 0.592 0.519 0.456 0.04 0.400 0.35! 0.351 0.308 0.270 0227 0.237 200 0.208 0.182 0.160 0.140 0.285 0.263 15% 0.870 0.756 0.658 0.572 0.572 0.497 0.432 0.376 0.327 0.284 0.247 0.215 0.187 0.163 0.141 0.123 0.107 0.093 0.081 0.070 0.061 0.030 0.015 0.004 0.001 10 44 11 0.243 0.208 40 0.178 0.152 0.130 0.111 095 0.095 0.667 0.444 0.296 0.198 0.132 w 0.088 0.059 0.039 J. 0.026 0.026 0.017 0.017 0.012 0.008 0.005 0.003 0.640 0.512 0.410 0.328 0.262 0.210 0.168 D.108 0.134 0.107 os 0.086 0.069 co 0.055 0.044 0.035 0.028 0.023 0.706 0.593 0.499 0.499 0.419 0.352 0.296 0.249 0.209 0.209 0.176 10 0.148 0.124 0.104 0.088 007 0.074 0.062 0.052 0.044 0.037 0.031 0.013 0.005 0.001 0 14 13 12 20% 0.833 0.694 0.579 0.482 W.02 0.402 0.335 0.279 0.233 0.194 0.162 0.135 0.112 0.093 0.078 0.065 0.054 0.045 0.038 0.031 0.026 0.010 0.004 0.001 0 0.314 0.266 0.266 0.225 0.191 0.162 0.137 0.116 0.099 0.084 0.071 0.060 0.051 0.043 0.037 0.016 0.007 0.001 30% 0.769 0.592 0.455 0.350 0.269 0.207 0.159 0.123 0.120 0.094 0.073 DES 0.056 0.043 003 0.033 0.025 0.020 0.015 0.012 0.009 0.007 0.005 0.001 0 o 35% 0.741 0.549 0.406 0.301 0.223 0.165 0.122 0.091 0.067 0.050 0.037 0.027 0.020 0.015 0.011 0.008 0.006 0.005 0.003 0.002 0.001 o 40% 0.714 0.510 0.364 0.260 0.186 0.133 0.095 0.095 0.068 0.048 0.035 0.025 0.018 0.013 0.009 nos 0.006 0.005 0.003 0.002 0.002 0.001 o 0.227 0.227 0.195 160 0.168 0.145 0.125 0.108 0.093 0.080 0.069 0.060 0.051 0.024 0.012 0.003 0.001 14 15 16 17 0.123 0.108 0.141 0.125 0.111 0.098 0.087 0.047 0.026 0.008 0.002 18 19 20 25 30 40 0.002 0.002 0.001 0.001 o o 0.081 0.069 0.059 0.051 0.043 0.020 0.009 0.002 0 0.095 0.083 0.073 0.038 0.020 0.005 0.001 0.018 0.014 0.012 0.004 0.001 0 0 0 0 0 0 0 o 50 0 0 0 0 0 Universal Electronics is considering the purchase of manufacturing equipment with a 10-year midpoint in its asset depreciation range (ADR). Carefully refer to Table 1211 to determine in what depreciation category the asset falls. (Hint: It is not 10 years.) The asset will cost $255,000, and it will produce earnings before depreciation and taxes of $85,000 per year for three years, and then $40,000 a year for seven more years. The firm has a tax rate of 25 percent. Assume the cost of capital is 14 percent. In doing your analysis, if you have years in which there is no depreciation, merely enter a zero for depreciation. Use Table 1212. Use Appendix B for an approximate answer but calculate your final answer using the formula and financial calculator methods. a. Calculate the net present value. (Do not round intermediate calculations and round your answer to 2 decimal places.) Net present value b. Based on the net present value, should Universal Electronics purchase the asset? O Yes O No
Step by Step Solution
There are 3 Steps involved in it

Get step-by-step solutions from verified subject matter experts