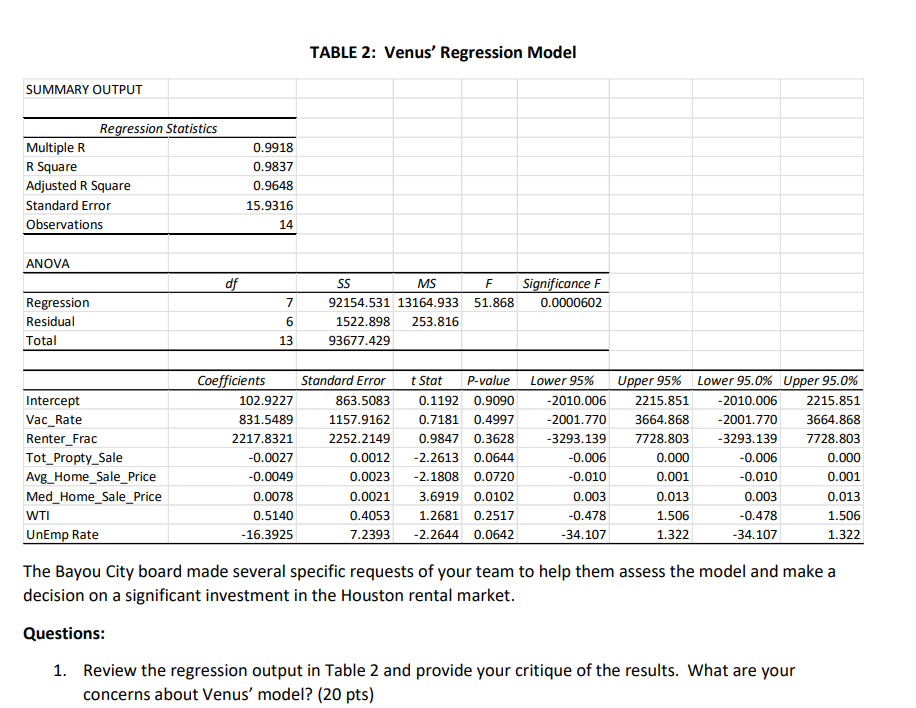
Question: TABLE 2: Venus' Regression Model SUMMARY OUTPUT 0.9918 0.9837 Regression Statistics Multiple R R Square Adjusted R Square Standard Error Observations 0.9648 15.9316 14 ANOVA

TABLE 2: Venus' Regression Model SUMMARY OUTPUT

TABLE 2: Venus' Regression Model SUMMARY OUTPUT 0.9918 0.9837 Regression Statistics Multiple R R Square Adjusted R Square Standard Error Observations 0.9648 15.9316 14 ANOVA df F 51.868 Significance F 0.0000602 Regression Residual Total 7 6 SS MS 92154.531 13164.933 1522.898 253.816 93677.429 13 Intercept Vac_Rate Renter_Frac Tot_Propty_Sale Avg_Home_Sale_Price Med_Home_Sale_Price WTI UnEmp Rate Coefficients 102.9227 831.5489 2217.8321 -0.0027 -0.0049 0.0078 0.5140 -16.3925 Standard Error 863.5083 1157.9162 2252.2149 0.0012 0.0023 0.0021 0.4053 7.2393 t Stat P-value 0.1192 0.9090 0.7181 0.4997 0.9847 0.3628 -2.2613 0.0644 -2.1808 0.0720 3.6919 0.0102 1.2681 0.2517 -2.2644 0.0642 Lower 95% -2010.006 -2001.770 -3293.139 -0.006 -0.010 0.003 -0.478 -34.107 Upper 95% Lower 95.0% Upper 95.0% 2215.851 -2010.006 2215.851 3664.868 -2001.770 3664.868 7728.803 -3293.139 7728.803 0.000 -0.006 0.000 0.001 -0.010 0.001 0.013 0.003 0.013 1.506 -0.478 1.506 1.322 -34.107 1.322 The Bayou City board made several specific requests of your team to help them assess the model and make a decision on a significant investment in the Houston rental market. Questions: 1. Review the regression output in Table 2 and provide your critique of the results. What are your concerns about Venus' model? (20 pts)

Step by Step Solution

There are 3 Steps involved in it

1 Expert Approved Answer
Step: 1 Unlock blur-text-image
Question Has Been Solved by an Expert!

Get step-by-step solutions from verified subject matter experts

Step: 2 Unlock
Step: 3 Unlock

Students Have Also Explored These Related General Management Questions!