

Question: Table 3 Predicting Cumulative Graduate Grade Point Average. They report the multiple R score for each of five different majors. Furthermore, they believe that the
Table 3 Predicting Cumulative Graduate Grade Point Average." They report the multiple R score for each of five different majors. Furthermore, they believe that the multiple R scores are underestimates, so they show "corrected multiple R" scores. Examine these key findings, and comment on the success of their multiple regression equations. Explain your reasoning.
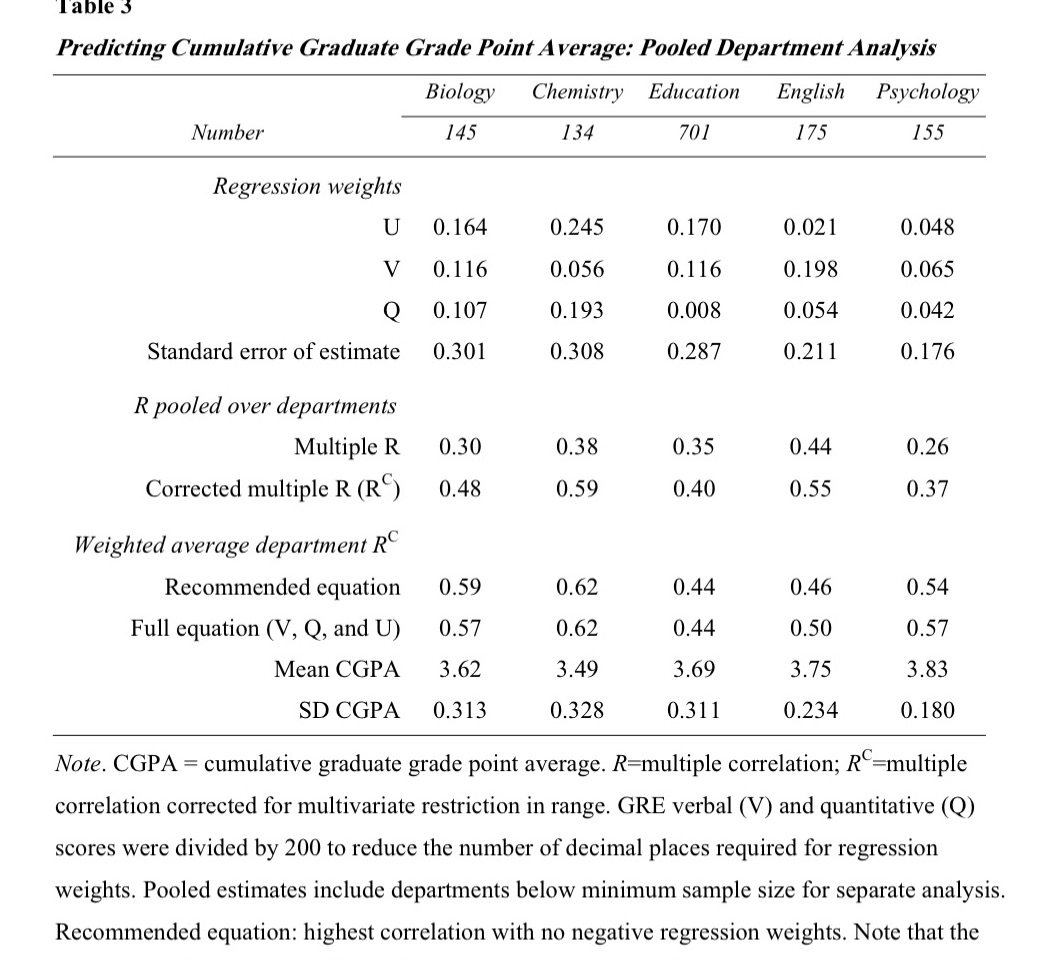
Table 3 Predicting Cumulative Graduate Grade Point Average: Pooled Department Analysis Biology Chemistry Education English Psychology Number 145 134 701 175 155 Regression weights U 0.164 0.245 0.170 0.021 0.048 V 0.116 0.056 0.116 0.198 0.065 Q 0.107 0.193 0.008 0.054 0.042 Standard error of estimate 0.301 0.308 0.287 0.211 0.176 R pooled over departments Multiple R 0.30 0.38 0.35 0.44 0.26 Corrected multiple R (R ) 0.48 0.59 0.40 0.55 0.37 Weighted average department RC Recommended equation 0.59 0.62 0.44 0.46 0.54 Full equation (V, Q, and U) 0.57 0.62 0.44 0.50 0.57 Mean CGPA 3.62 3.49 3.69 3.75 3.83 SD CGPA 0.313 0.328 0.311 0.234 0.180 Note. CGPA = cumulative graduate grade point average. R=multiple correlation; R"=multiple correlation corrected for multivariate restriction in range. GRE verbal (V) and quantitative (Q) scores were divided by 200 to reduce the number of decimal places required for regression weights. Pooled estimates include departments below minimum sample size for separate analysis. Recommended equation: highest correlation with no negative regression weights. Note that the
Step by Step Solution
There are 3 Steps involved in it

Get step-by-step solutions from verified subject matter experts