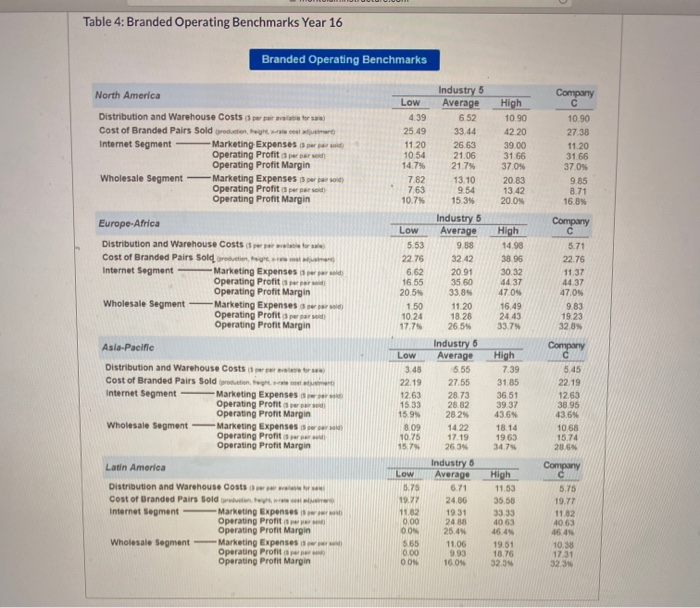
Question: Table 4: Branded Operating Benchmarks Year 16 Branded Operating Benchmarks North America Low 4.39 25.49 11.20 10.54 14.7% 7.82 7.63 10.7% Industry 5 Average 6.52

Table 4: Branded Operating Benchmarks Year 16
Table 4: Branded Operating Benchmarks Year 16 Branded Operating Benchmarks North America Low 4.39 25.49 11.20 10.54 14.7% 7.82 7.63 10.7% Industry 5 Average 6.52 33.44 26.63 21.06 21.7% 13.10 9.54 15.3% High 10.90 42.20 39.00 31.66 3709 20.83 13.42 20.0% Company 10.90 27.38 11 20 31.66 37.0% 9.85 8.71 16.8% Distribution and Warehouse Costs de para tor) Cost of Branded Pairs Sold producten. Het Internet Segment -Marketing Expenses ar Operating Profit per pared) Operating Profit Margin Wholesale Segment -Marketing Expenses per part Operating Profit per perso Operating Profit Margin Europe-Africa Distribution and Warehouse Costs for Cost of Branded Pairs Soldering Internet Segment Marketing Expenses par Operating Profit Operating Profit Margin Wholesale Segment Marketing Expenses per Operating profitar Operating Profit Margin Low 5.53 22.76 6.62 16:55 20.5% 1.50 10.24 17.75 High 14.98 38.96 30.32 4437 47 04 16.49 24.43 33.7% Company C 5.71 22.76 11.37 44.37 4709 9.83 19.23 32.8% Asia-Pacific Low Distribution and Warehouse Costs Cost of Branded Pairs Sold out Internet segment -Marketing Expenses Operating Profit Operating profit Margin Wholesale segment - Marketing Expenses Operating Profit Operating Profit Margin 3.48 22.19 12.63 15:33 15.9% 8.09 10.75 15.7 Industry 6 Average 9.88 3242 20.91 35.60 33.89 11 20 18.26 26.5% Industry Average 5.55 27.55 28.73 28.82 28 2% 1422 17.19 2639 Industry Average 671 24.06 19 31 2488 25.4 11.06 9.93 16 ON High 7.39 31.85 36 51 3937 43.6 18.14 1963 34.7 Company C 5.45 22.19 1263 38.95 43.6% 1068 15.74 28.6 Latin America Distribution and Warehouse Costs Cost of Branded Pairs Sold want Internet segment Marketing Expenses Operating Profit Operating Profit Margin Wholesale segment Marketing Expenses Operating Profit Operating Profit margin Low 3.75 19.27 11.82 0.00 OON 5.65 0.00 O.ON High 11.53 36,58 33.33 40.63 Company 5.75 19.77 11.82 40.63 19.51 18.76 323 10.38 17:31 323 List two (2) operating elements that Company C can improve on in the North America region. HTML Editor BIVA -A- IX E XX, E 12pt Paragraph O words Question 27 5 pts List three (3) operating elements that contribute to Company C's success in Latin America. Question 28 5 Overall, based on the operating benchmarks, is Company C doing well in year 16? Yes No Table 4: Branded Operating Benchmarks Year 16 Branded Operating Benchmarks North America Low 4.39 25.49 11.20 10.54 14.7% 7.82 7.63 10.7% Industry 5 Average 6.52 33.44 26.63 21.06 21.7% 13.10 9.54 15.3% High 10.90 42.20 39.00 31.66 3709 20.83 13.42 20.0% Company 10.90 27.38 11 20 31.66 37.0% 9.85 8.71 16.8% Distribution and Warehouse Costs de para tor) Cost of Branded Pairs Sold producten. Het Internet Segment -Marketing Expenses ar Operating Profit per pared) Operating Profit Margin Wholesale Segment -Marketing Expenses per part Operating Profit per perso Operating Profit Margin Europe-Africa Distribution and Warehouse Costs for Cost of Branded Pairs Soldering Internet Segment Marketing Expenses par Operating Profit Operating Profit Margin Wholesale Segment Marketing Expenses per Operating profitar Operating Profit Margin Low 5.53 22.76 6.62 16:55 20.5% 1.50 10.24 17.75 High 14.98 38.96 30.32 4437 47 04 16.49 24.43 33.7% Company C 5.71 22.76 11.37 44.37 4709 9.83 19.23 32.8% Asia-Pacific Low Distribution and Warehouse Costs Cost of Branded Pairs Sold out Internet segment -Marketing Expenses Operating Profit Operating profit Margin Wholesale segment - Marketing Expenses Operating Profit Operating Profit Margin 3.48 22.19 12.63 15:33 15.9% 8.09 10.75 15.7 Industry 6 Average 9.88 3242 20.91 35.60 33.89 11 20 18.26 26.5% Industry Average 5.55 27.55 28.73 28.82 28 2% 1422 17.19 2639 Industry Average 671 24.06 19 31 2488 25.4 11.06 9.93 16 ON High 7.39 31.85 36 51 3937 43.6 18.14 1963 34.7 Company C 5.45 22.19 1263 38.95 43.6% 1068 15.74 28.6 Latin America Distribution and Warehouse Costs Cost of Branded Pairs Sold want Internet segment Marketing Expenses Operating Profit Operating Profit Margin Wholesale segment Marketing Expenses Operating Profit Operating Profit margin Low 3.75 19.27 11.82 0.00 OON 5.65 0.00 O.ON High 11.53 36,58 33.33 40.63 Company 5.75 19.77 11.82 40.63 19.51 18.76 323 10.38 17:31 323 List two (2) operating elements that Company C can improve on in the North America region. HTML Editor BIVA -A- IX E XX, E 12pt Paragraph O words Question 27 5 pts List three (3) operating elements that contribute to Company C's success in Latin America. Question 28 5 Overall, based on the operating benchmarks, is Company C doing well in year 16? Yes No

Step by Step Solution

There are 3 Steps involved in it

1 Expert Approved Answer
Step: 1 Unlock blur-text-image
Question Has Been Solved by an Expert!

Get step-by-step solutions from verified subject matter experts

Step: 2 Unlock
Step: 3 Unlock

Students Have Also Explored These Related General Management Questions!