

Question: Table 4.4: Tests Asymp. Sig. (2-sided) Exact sig. (2-sided) Exact sig. (1-sided) Value df Pearson Chi-Square 9.513b 1 .002 Continuity Correction a 8.396 1 .004
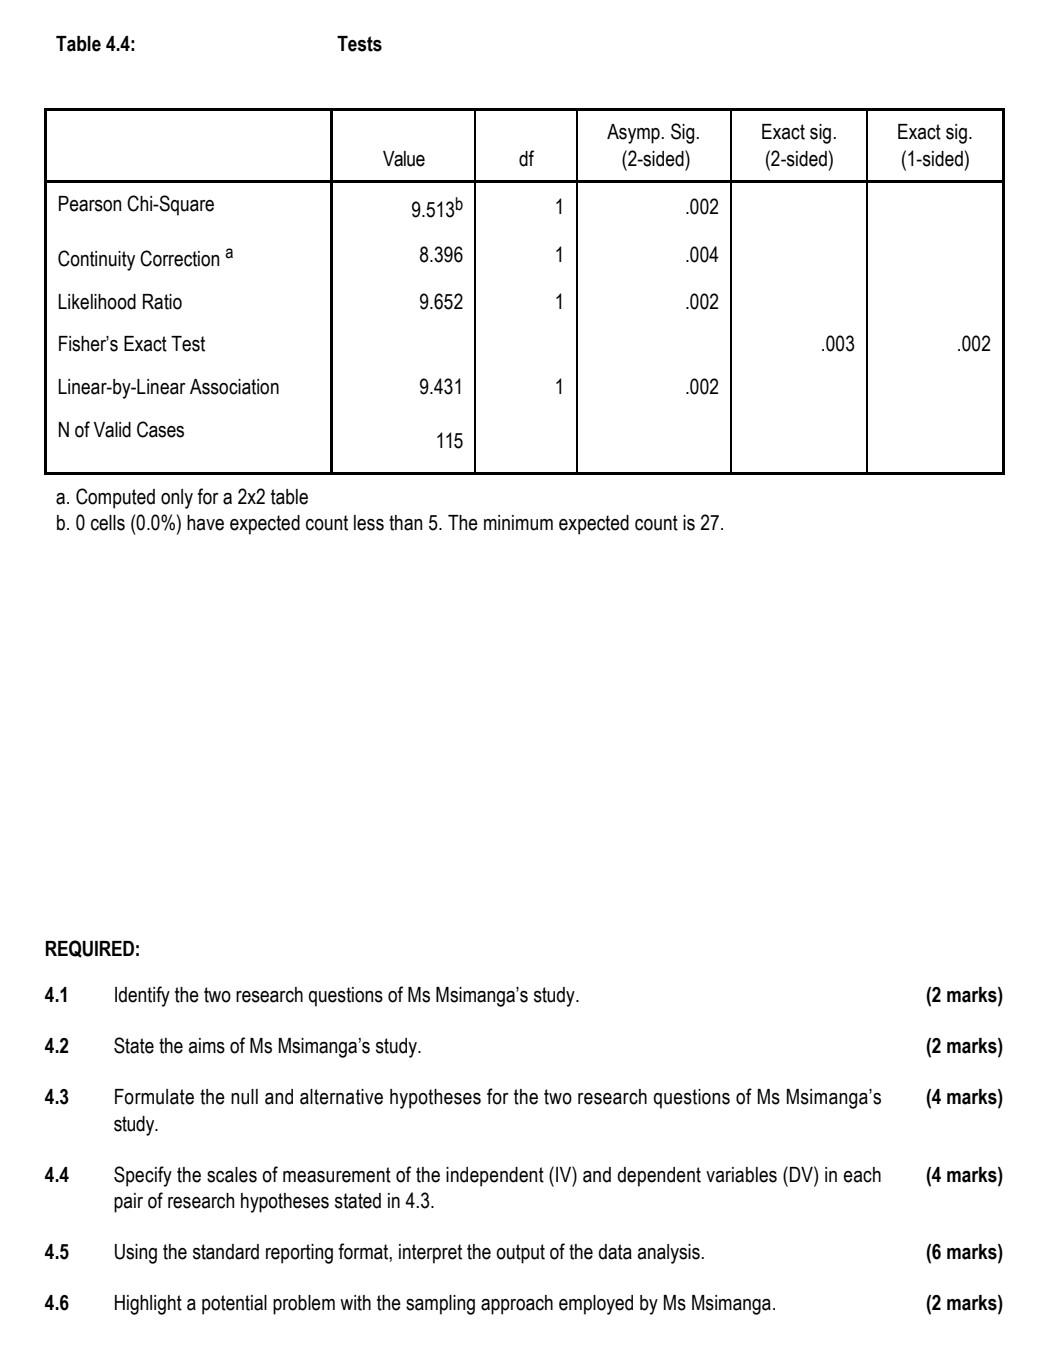


Table 4.4: Tests Asymp. Sig. (2-sided) Exact sig. (2-sided) Exact sig. (1-sided) Value df Pearson Chi-Square 9.513b 1 .002 Continuity Correction a 8.396 1 .004 Likelihood Ratio 9.652 1 .002 Fisher's Exact Test .003 .002 Linear-by-Linear Association 9.431 1 .002 N of Valid Cases 115 a. Computed only for a 2x2 table b. O cells (0.0%) have expected count less than 5. The minimum expected count is 27. REQUIRED: 4.1 Identify the two research questions of Ms Msimanga's study. (2 marks) 4.2 State the aims of Ms Msimanga's study. (2 marks) 4.3 (4 marks) Formulate the null and alternative hypotheses for the two research questions of Ms Msimanga's study. 4.4 (4 marks) Specify the scales of measurement of the independent (IV) and dependent variables (DV) in each pair of research hypotheses stated in 4.3. 4.5 Using the standard reporting format, interpret the output of the data analysis. (6 marks) 4.6 Highlight a potential problem with the sampling approach employed by Ms Msimanga. (2 marks) Table 4.4: Tests Asymp. Sig. (2-sided) Exact sig. (2-sided) Exact sig. (1-sided) Value df Pearson Chi-Square 9.513b 1 .002 Continuity Correction a 8.396 1 .004 Likelihood Ratio 9.652 1 .002 Fisher's Exact Test .003 .002 Linear-by-Linear Association 9.431 1 .002 N of Valid Cases 115 a. Computed only for a 2x2 table b. O cells (0.0%) have expected count less than 5. The minimum expected count is 27. REQUIRED: 4.1 Identify the two research questions of Ms Msimanga's study. (2 marks) 4.2 State the aims of Ms Msimanga's study. (2 marks) 4.3 (4 marks) Formulate the null and alternative hypotheses for the two research questions of Ms Msimanga's study. 4.4 (4 marks) Specify the scales of measurement of the independent (IV) and dependent variables (DV) in each pair of research hypotheses stated in 4.3. 4.5 Using the standard reporting format, interpret the output of the data analysis. (6 marks) 4.6 Highlight a potential problem with the sampling approach employed by Ms Msimanga. (2 marks) Table 4.4: Tests Asymp. Sig. (2-sided) Exact sig. (2-sided) Exact sig. (1-sided) Value df Pearson Chi-Square 9.513b 1 .002 Continuity Correction a 8.396 1 .004 Likelihood Ratio 9.652 1 .002 Fisher's Exact Test .003 .002 Linear-by-Linear Association 9.431 1 .002 N of Valid Cases 115 a. Computed only for a 2x2 table b. O cells (0.0%) have expected count less than 5. The minimum expected count is 27. REQUIRED: 4.1 Identify the two research questions of Ms Msimanga's study. (2 marks) 4.2 State the aims of Ms Msimanga's study. (2 marks) 4.3 (4 marks) Formulate the null and alternative hypotheses for the two research questions of Ms Msimanga's study. 4.4 (4 marks) Specify the scales of measurement of the independent (IV) and dependent variables (DV) in each pair of research hypotheses stated in 4.3. 4.5 Using the standard reporting format, interpret the output of the data analysis. (6 marks) 4.6 Highlight a potential problem with the sampling approach employed by Ms Msimanga. (2 marks) Table 4.4: Tests Asymp. Sig. (2-sided) Exact sig. (2-sided) Exact sig. (1-sided) Value df Pearson Chi-Square 9.513b 1 .002 Continuity Correction a 8.396 1 .004 Likelihood Ratio 9.652 1 .002 Fisher's Exact Test .003 .002 Linear-by-Linear Association 9.431 1 .002 N of Valid Cases 115 a. Computed only for a 2x2 table b. O cells (0.0%) have expected count less than 5. The minimum expected count is 27. REQUIRED: 4.1 Identify the two research questions of Ms Msimanga's study. (2 marks) 4.2 State the aims of Ms Msimanga's study. (2 marks) 4.3 (4 marks) Formulate the null and alternative hypotheses for the two research questions of Ms Msimanga's study. 4.4 (4 marks) Specify the scales of measurement of the independent (IV) and dependent variables (DV) in each pair of research hypotheses stated in 4.3. 4.5 Using the standard reporting format, interpret the output of the data analysis. (6 marks) 4.6 Highlight a potential problem with the sampling approach employed by Ms Msimanga. (2 marks) Table 4.4: Tests Asymp. Sig. (2-sided) Exact sig. (2-sided) Exact sig. (1-sided) Value df Pearson Chi-Square 9.513b 1 .002 Continuity Correction a 8.396 1 .004 Likelihood Ratio 9.652 1 .002 Fisher's Exact Test .003 .002 Linear-by-Linear Association 9.431 1 .002 N of Valid Cases 115 a. Computed only for a 2x2 table b. O cells (0.0%) have expected count less than 5. The minimum expected count is 27. REQUIRED: 4.1 Identify the two research questions of Ms Msimanga's study. (2 marks) 4.2 State the aims of Ms Msimanga's study. (2 marks) 4.3 (4 marks) Formulate the null and alternative hypotheses for the two research questions of Ms Msimanga's study. 4.4 (4 marks) Specify the scales of measurement of the independent (IV) and dependent variables (DV) in each pair of research hypotheses stated in 4.3. 4.5 Using the standard reporting format, interpret the output of the data analysis. (6 marks) 4.6 Highlight a potential problem with the sampling approach employed by Ms Msimanga. (2 marks) Table 4.4: Tests Asymp. Sig. (2-sided) Exact sig. (2-sided) Exact sig. (1-sided) Value df Pearson Chi-Square 9.513b 1 .002 Continuity Correction a 8.396 1 .004 Likelihood Ratio 9.652 1 .002 Fisher's Exact Test .003 .002 Linear-by-Linear Association 9.431 1 .002 N of Valid Cases 115 a. Computed only for a 2x2 table b. O cells (0.0%) have expected count less than 5. The minimum expected count is 27. REQUIRED: 4.1 Identify the two research questions of Ms Msimanga's study. (2 marks) 4.2 State the aims of Ms Msimanga's study. (2 marks) 4.3 (4 marks) Formulate the null and alternative hypotheses for the two research questions of Ms Msimanga's study. 4.4 (4 marks) Specify the scales of measurement of the independent (IV) and dependent variables (DV) in each pair of research hypotheses stated in 4.3. 4.5 Using the standard reporting format, interpret the output of the data analysis. (6 marks) 4.6 Highlight a potential problem with the sampling approach employed by Ms Msimanga. (2 marks) Table 4.4: Tests Asymp. Sig. (2-sided) Exact sig. (2-sided) Exact sig. (1-sided) Value df Pearson Chi-Square 9.513b 1 .002 Continuity Correction a 8.396 1 .004 Likelihood Ratio 9.652 1 .002 Fisher's Exact Test .003 .002 Linear-by-Linear Association 9.431 1 .002 N of Valid Cases 115 a. Computed only for a 2x2 table b. O cells (0.0%) have expected count less than 5. The minimum expected count is 27. REQUIRED: 4.1 Identify the two research questions of Ms Msimanga's study. (2 marks) 4.2 State the aims of Ms Msimanga's study. (2 marks) 4.3 (4 marks) Formulate the null and alternative hypotheses for the two research questions of Ms Msimanga's study. 4.4 (4 marks) Specify the scales of measurement of the independent (IV) and dependent variables (DV) in each pair of research hypotheses stated in 4.3. 4.5 Using the standard reporting format, interpret the output of the data analysis. (6 marks) 4.6 Highlight a potential problem with the sampling approach employed by Ms Msimanga. (2 marks) Table 4.4: Tests Asymp. Sig. (2-sided) Exact sig. (2-sided) Exact sig. (1-sided) Value df Pearson Chi-Square 9.513b 1 .002 Continuity Correction a 8.396 1 .004 Likelihood Ratio 9.652 1 .002 Fisher's Exact Test .003 .002 Linear-by-Linear Association 9.431 1 .002 N of Valid Cases 115 a. Computed only for a 2x2 table b. O cells (0.0%) have expected count less than 5. The minimum expected count is 27. REQUIRED: 4.1 Identify the two research questions of Ms Msimanga's study. (2 marks) 4.2 State the aims of Ms Msimanga's study. (2 marks) 4.3 (4 marks) Formulate the null and alternative hypotheses for the two research questions of Ms Msimanga's study. 4.4 (4 marks) Specify the scales of measurement of the independent (IV) and dependent variables (DV) in each pair of research hypotheses stated in 4.3. 4.5 Using the standard reporting format, interpret the output of the data analysis. (6 marks) 4.6 Highlight a potential problem with the sampling approach employed by Ms Msimanga. (2 marks) Table 4.4: Tests Asymp. Sig. (2-sided) Exact sig. (2-sided) Exact sig. (1-sided) Value df Pearson Chi-Square 9.513b 1 .002 Continuity Correction a 8.396 1 .004 Likelihood Ratio 9.652 1 .002 Fisher's Exact Test .003 .002 Linear-by-Linear Association 9.431 1 .002 N of Valid Cases 115 a. Computed only for a 2x2 table b. O cells (0.0%) have expected count less than 5. The minimum expected count is 27. REQUIRED: 4.1 Identify the two research questions of Ms Msimanga's study. (2 marks) 4.2 State the aims of Ms Msimanga's study. (2 marks) 4.3 (4 marks) Formulate the null and alternative hypotheses for the two research questions of Ms Msimanga's study. 4.4 (4 marks) Specify the scales of measurement of the independent (IV) and dependent variables (DV) in each pair of research hypotheses stated in 4.3. 4.5 Using the standard reporting format, interpret the output of the data analysis. (6 marks) 4.6 Highlight a potential problem with the sampling approach employed by Ms Msimanga. (2 marks) Table 4.4: Tests Asymp. Sig. (2-sided) Exact sig. (2-sided) Exact sig. (1-sided) Value df Pearson Chi-Square 9.513b 1 .002 Continuity Correction a 8.396 1 .004 Likelihood Ratio 9.652 1 .002 Fisher's Exact Test .003 .002 Linear-by-Linear Association 9.431 1 .002 N of Valid Cases 115 a. Computed only for a 2x2 table b. O cells (0.0%) have expected count less than 5. The minimum expected count is 27. REQUIRED: 4.1 Identify the two research questions of Ms Msimanga's study. (2 marks) 4.2 State the aims of Ms Msimanga's study. (2 marks) 4.3 (4 marks) Formulate the null and alternative hypotheses for the two research questions of Ms Msimanga's study. 4.4 (4 marks) Specify the scales of measurement of the independent (IV) and dependent variables (DV) in each pair of research hypotheses stated in 4.3. 4.5 Using the standard reporting format, interpret the output of the data analysis. (6 marks) 4.6 Highlight a potential problem with the sampling approach employed by Ms Msimanga. (2 marks)
Step by Step Solution
There are 3 Steps involved in it

Get step-by-step solutions from verified subject matter experts