

Question: Table 5 - 3 The following table shows the demand schedule for a particular good. table [ [ Price , Quantity ] , [
Table
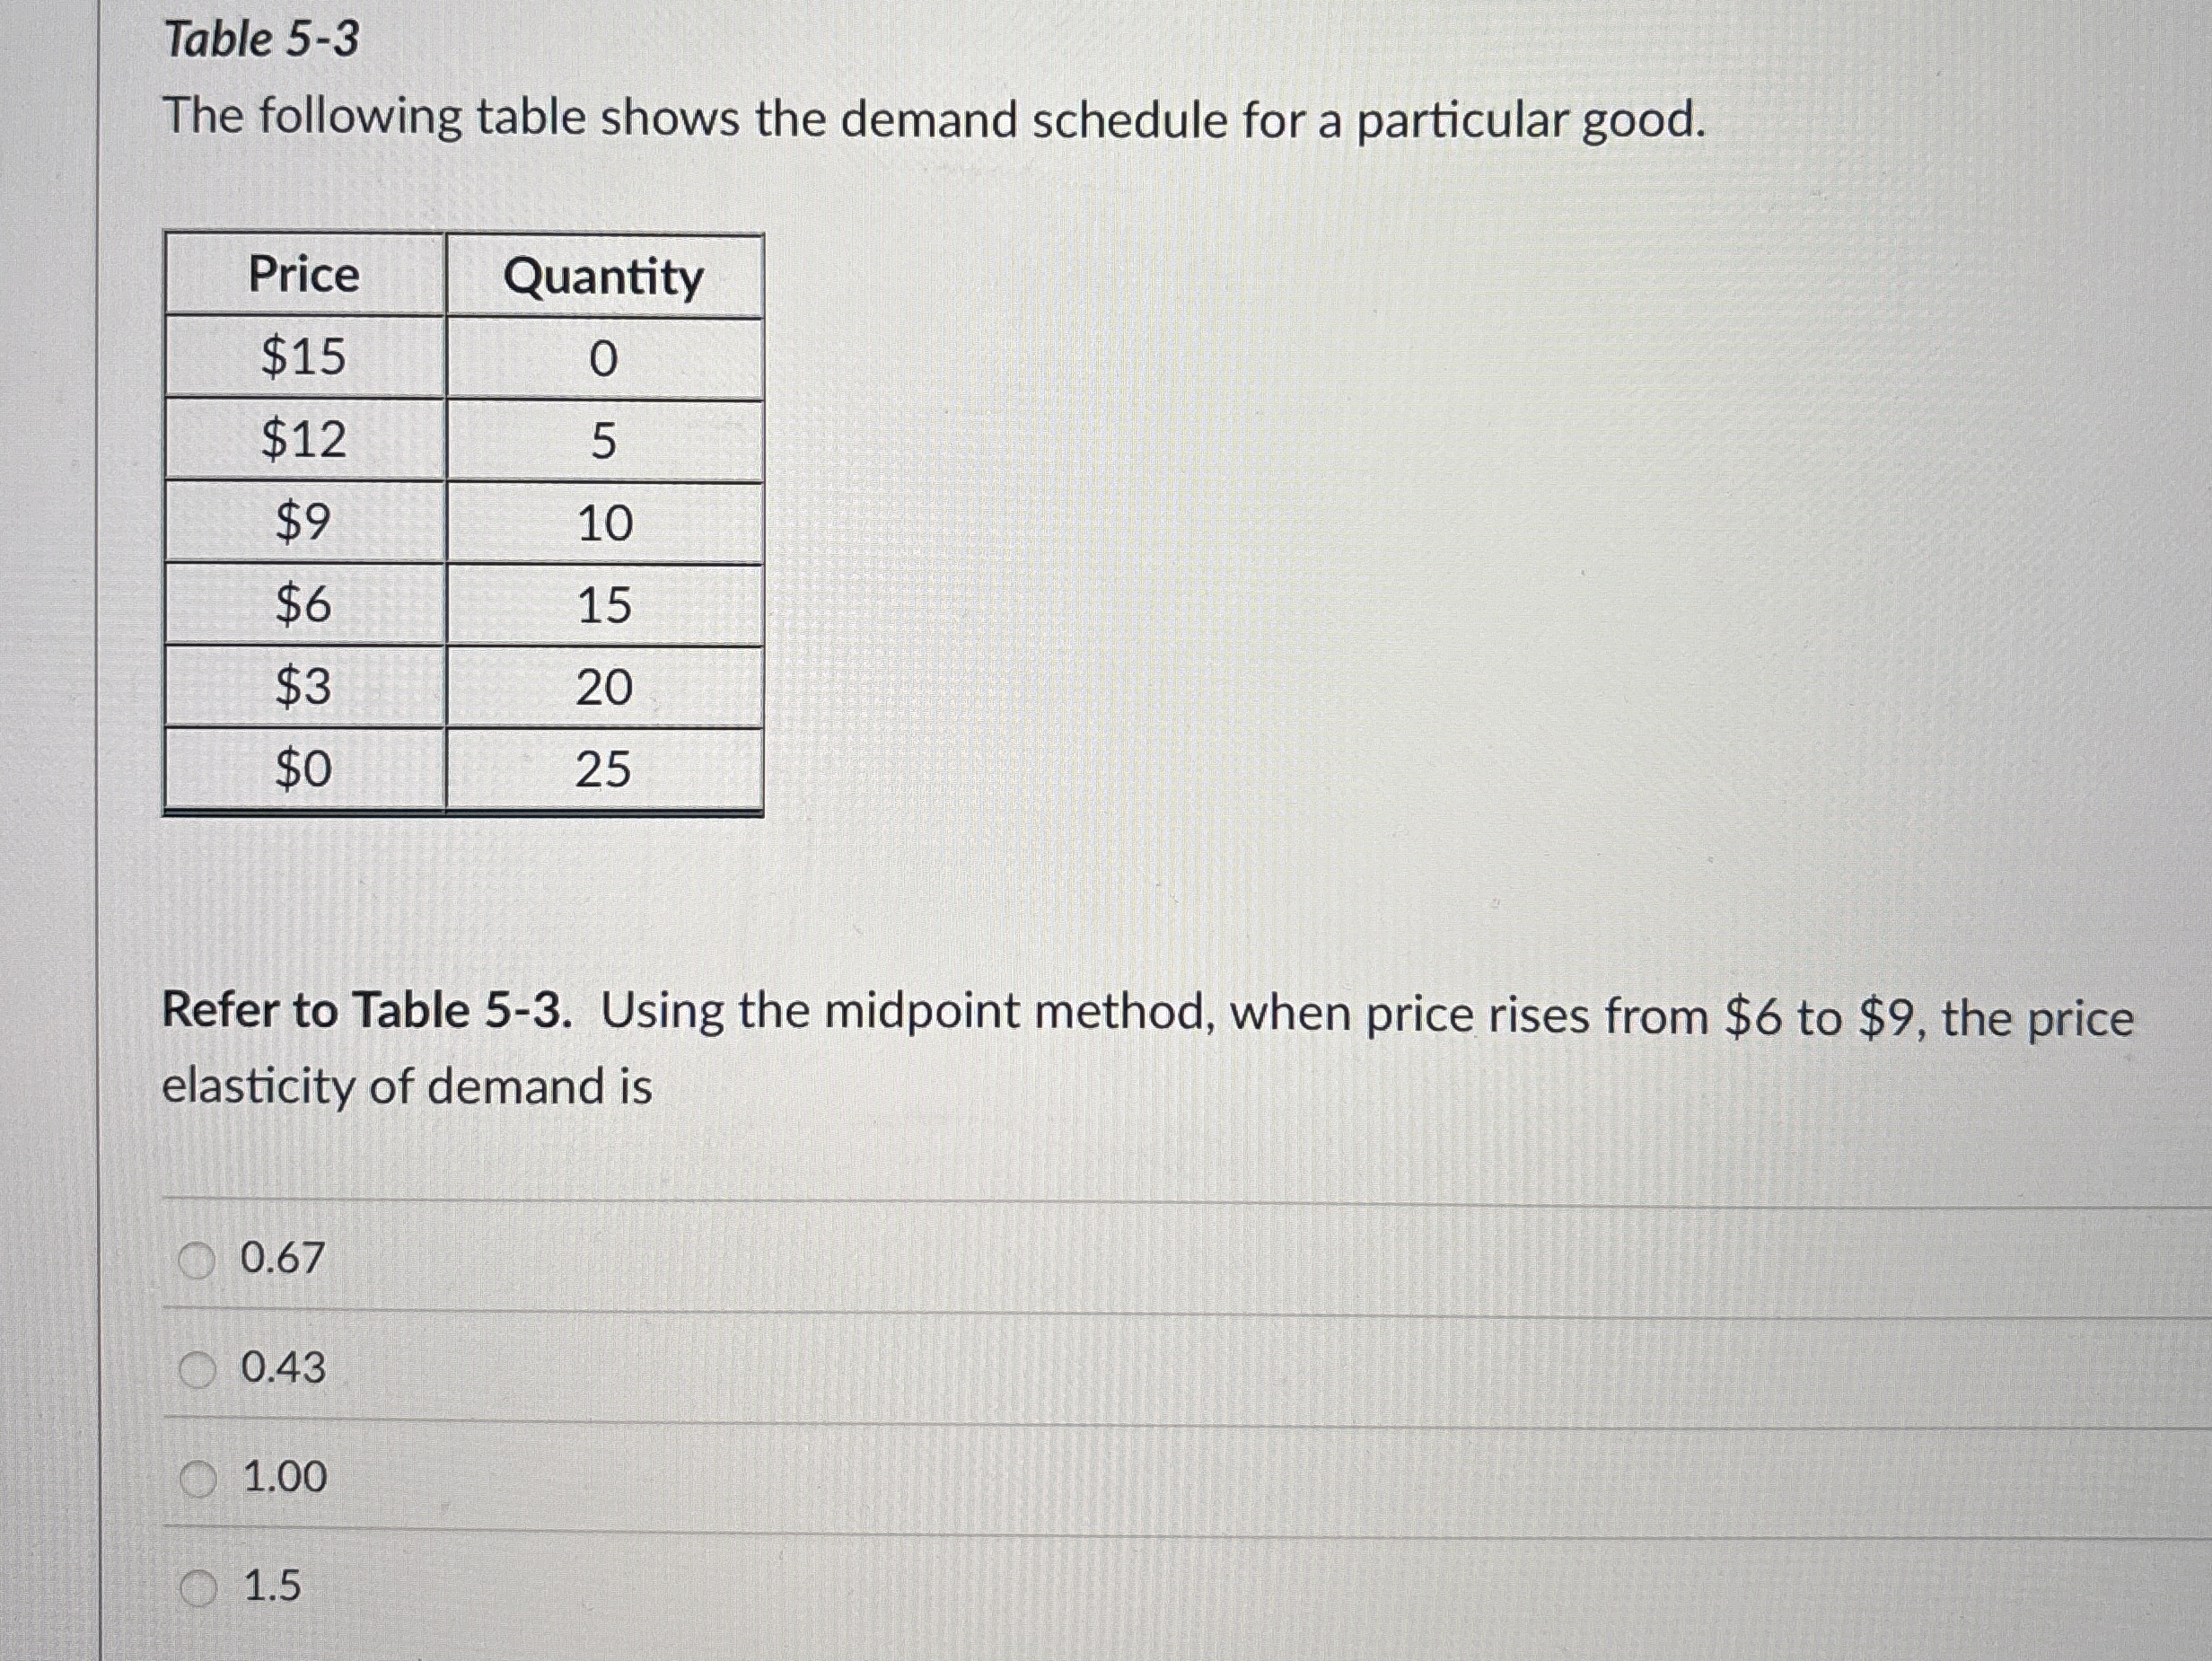
The following table shows the demand schedule for a particular good.
tablePriceQuantity$$$$$$
Refer to Table Using the midpoint method, when price rises from $ to $ the price elasticity of demand is
Step by Step Solution
There are 3 Steps involved in it
1 Expert Approved Answer
Step: 1 Unlock

Question Has Been Solved by an Expert!
Get step-by-step solutions from verified subject matter experts
Step: 2 Unlock
Step: 3 Unlock