

Question: Table 5-3 The following table shows the demand schedule for a particular good. table[[Price,Quantity],[ $15 ,0],[ $12 ,5],[ $9 ,10],[ $6 ,15],[ $3 ,20],[ $0
Table 5-3\ The following table shows the demand schedule for a particular good.\ \\\\table[[Price,Quantity],[
$15,0],[
$12,5],[
$9,10],[
$6,15],[
$3,20],[
$0,25]]\ Refer to Table 5-3. Using the midpoint method, what is the price elasticity of der price rises from
$9to
$12?\ 1.50\ 0.43\ 2.33\ 0.67
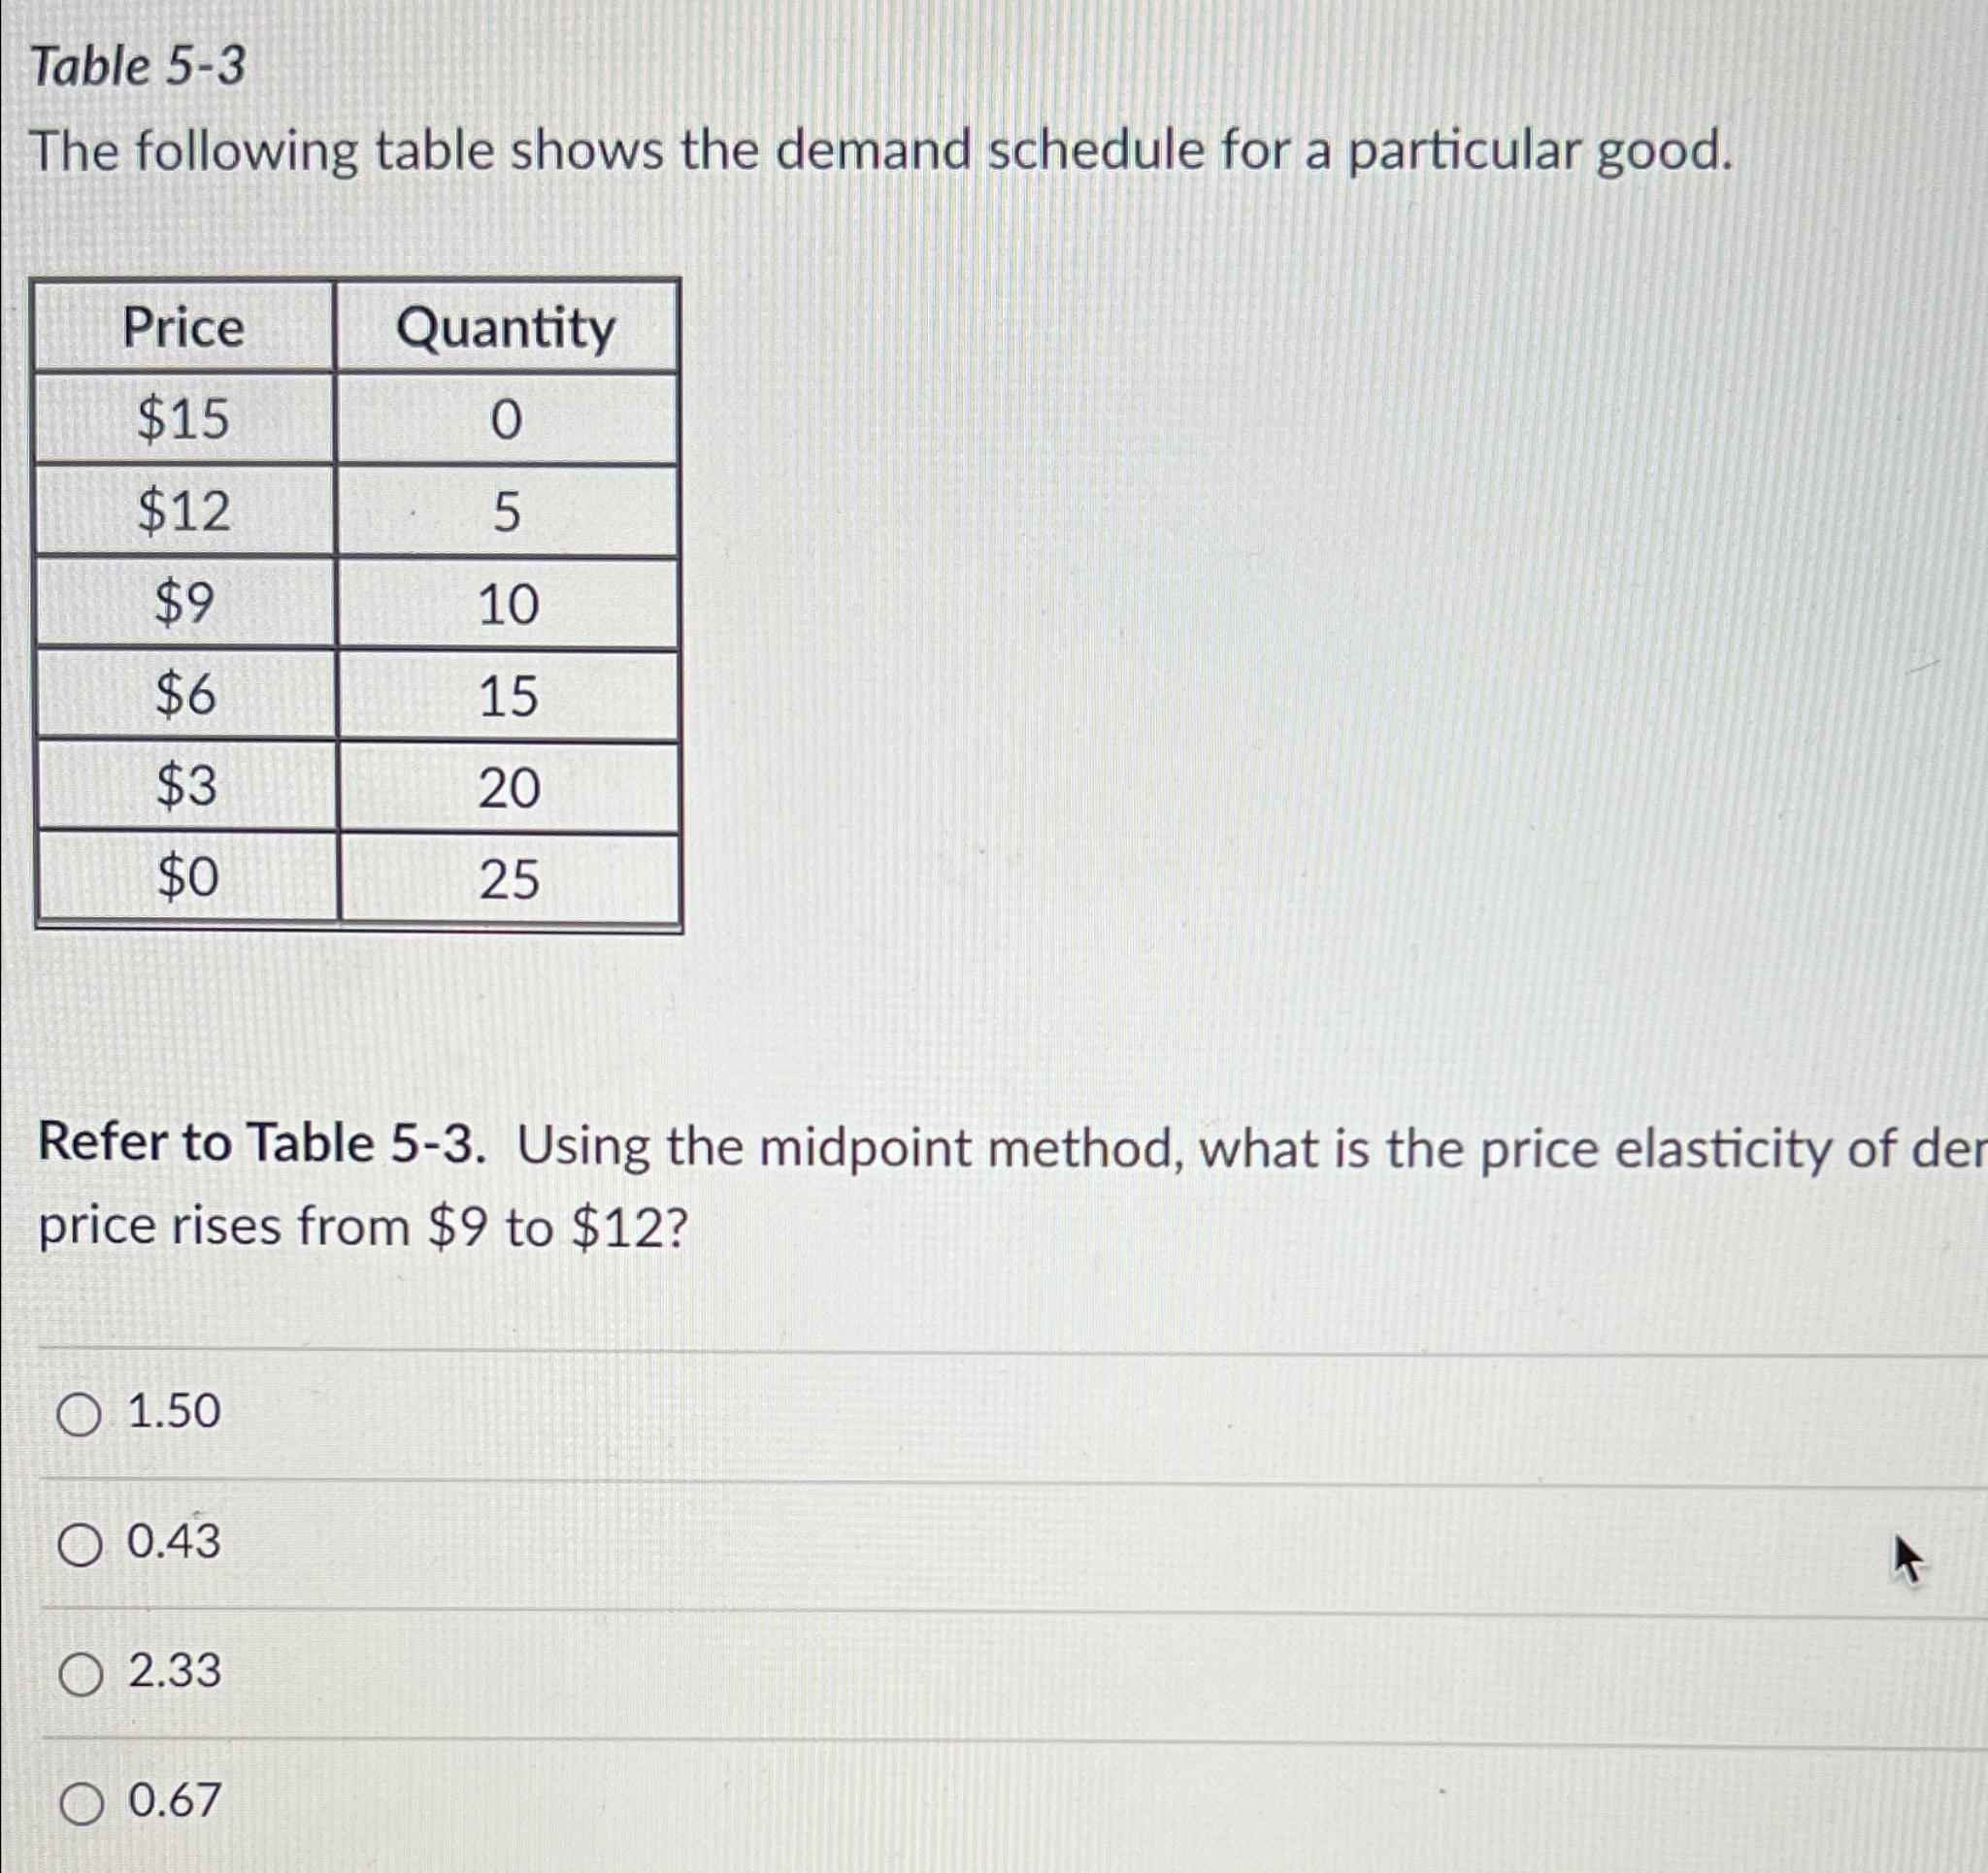
The following table shows the demand schedule for a particular good. Refer to Table 5-3. Using the midpoint method, what is the price elasticity of der price rises from $9 to $12 ? 1.50 0.43 2.33 0.67
Step by Step Solution
There are 3 Steps involved in it
1 Expert Approved Answer
Step: 1 Unlock

Question Has Been Solved by an Expert!
Get step-by-step solutions from verified subject matter experts
Step: 2 Unlock
Step: 3 Unlock