

Question: Table 5 - 8 Middle School Classroom Capacity Figures On the two school worksheets, calculate Average Students per Room in column D and totals in
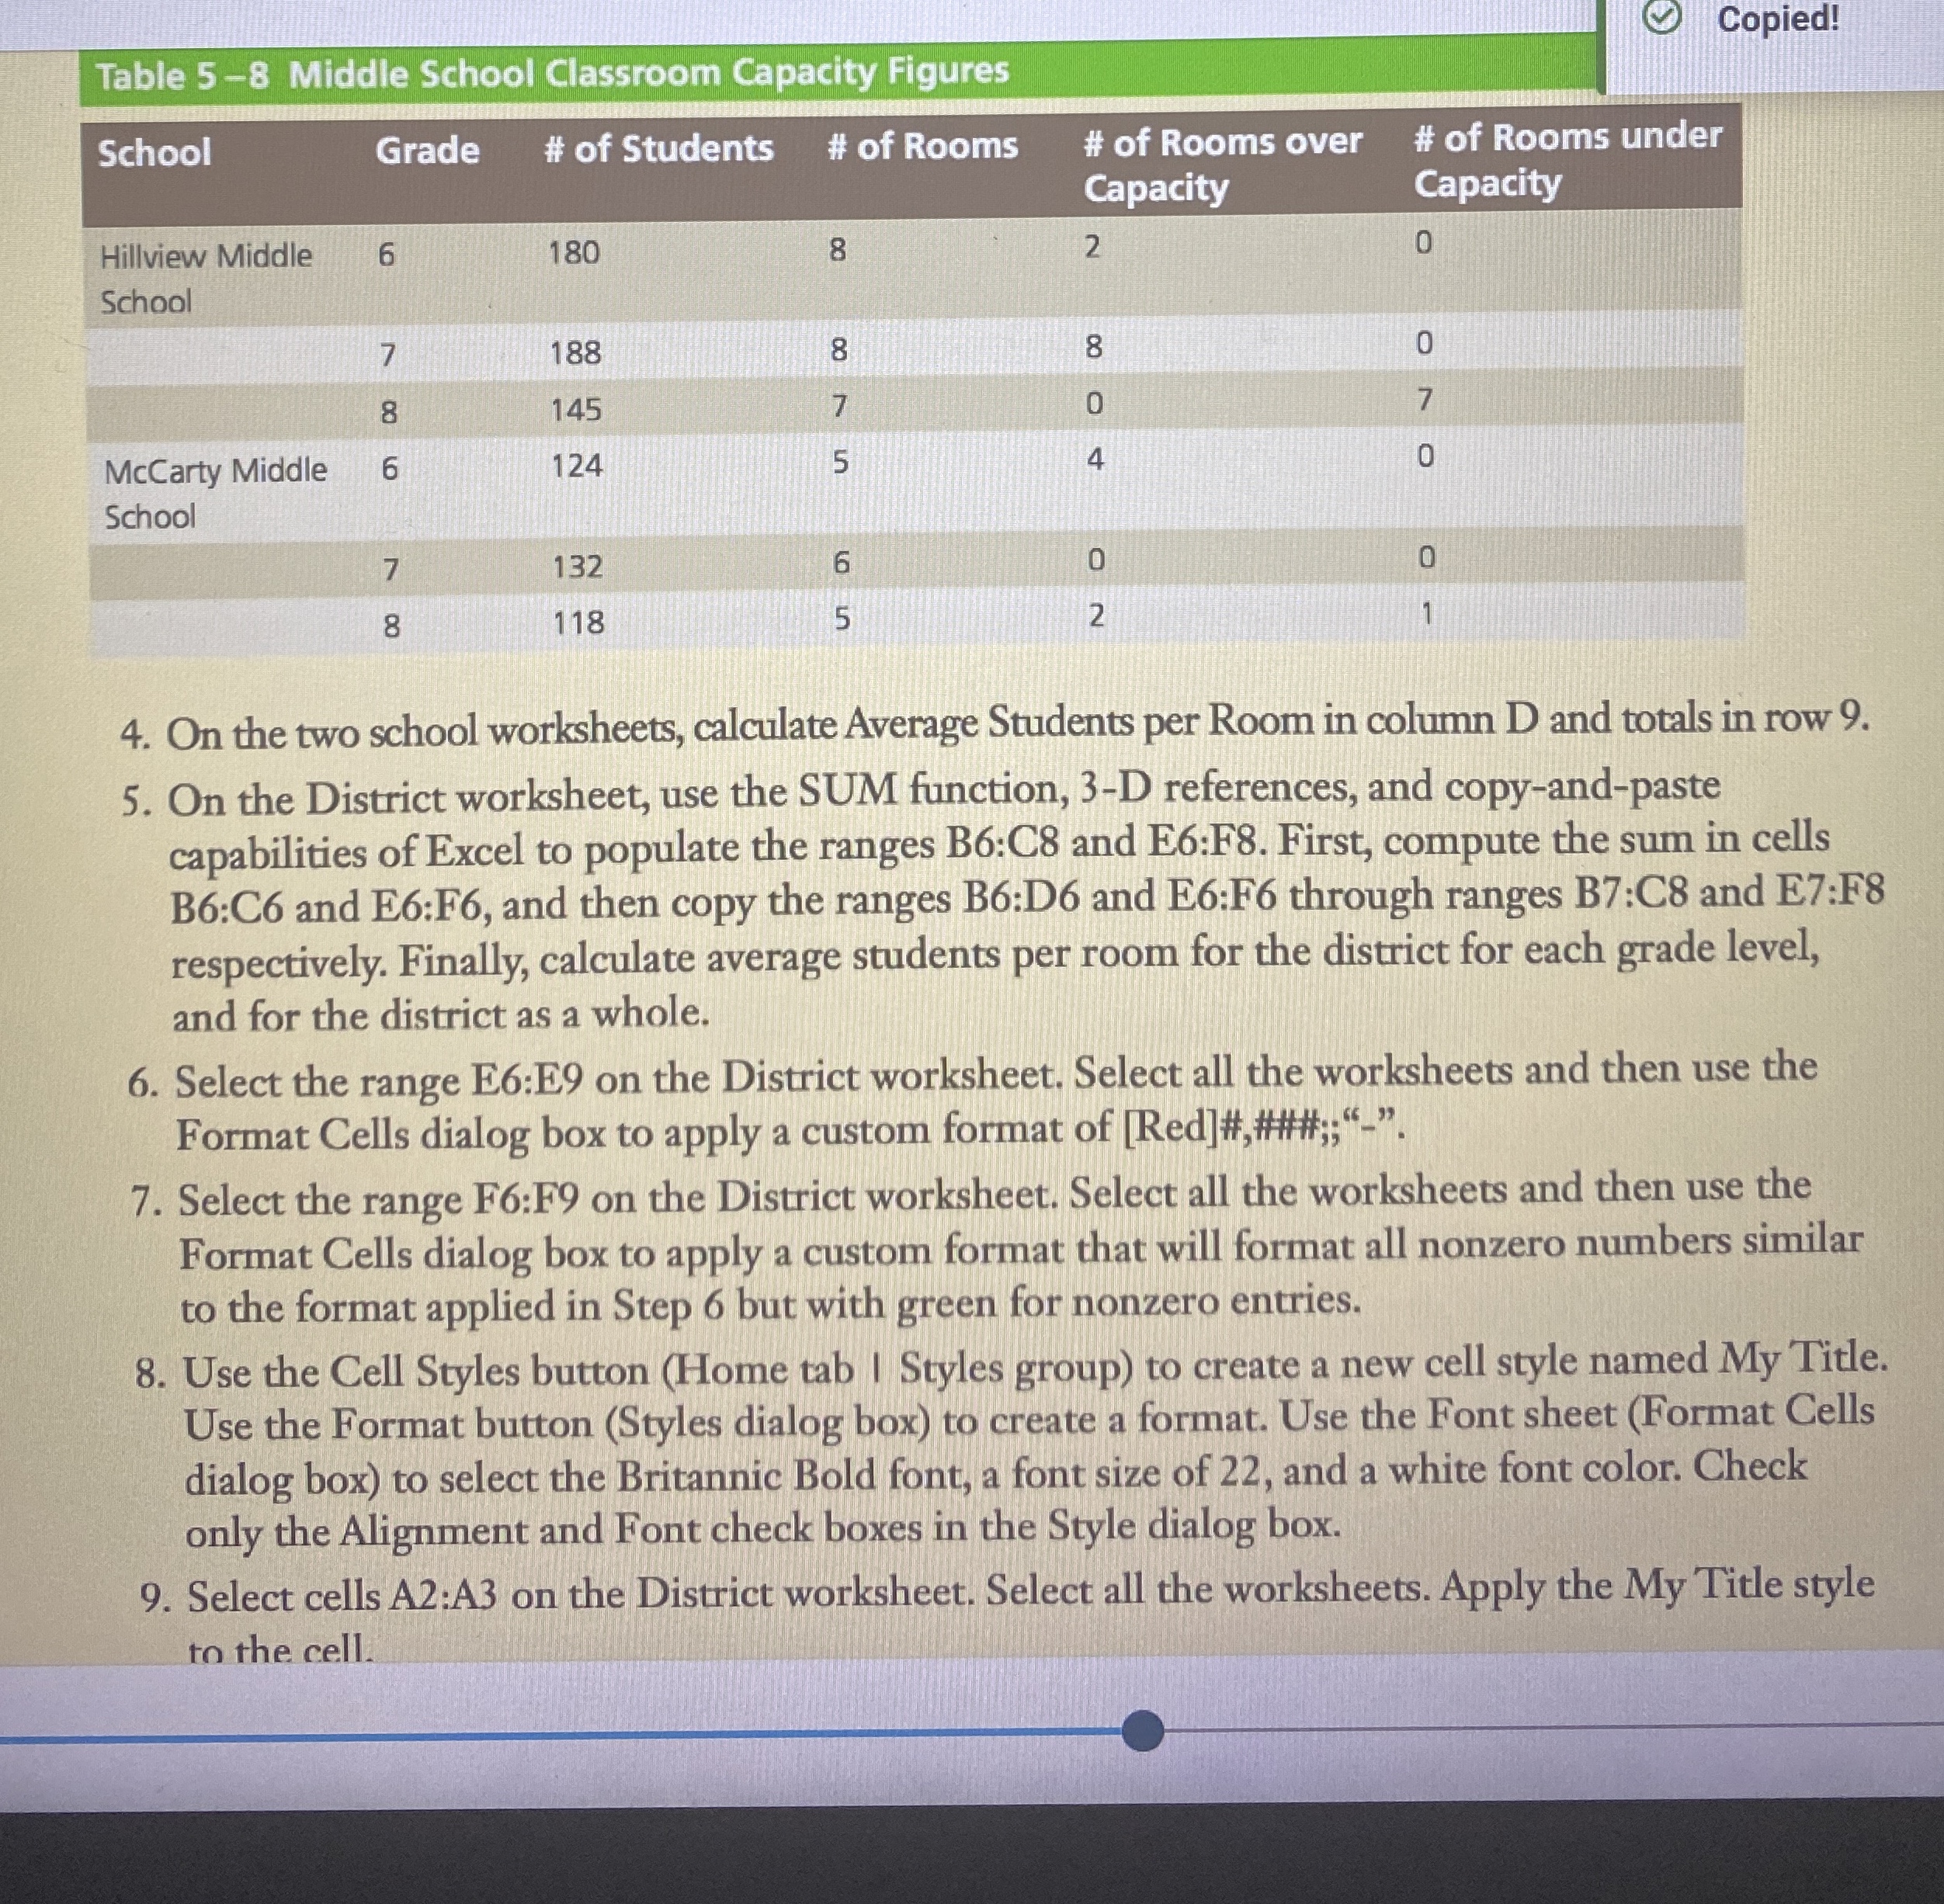
Table Middle School Classroom Capacity Figures
On the two school worksheets, calculate Average Students per Room in column and totals in row
On the District worksheet, use the SUM function, D references, and copyandpaste
capabilities of Excel to populate the ranges B:C and E:F First, compute the sum in cells
B:C and E:F and then copy the ranges B:D and E:F through ranges B:C and E:F
respectively. Finally, calculate average students per room for the district for each grade level,
and for the district as a whole.
Select the range E:E on the District worksheet. Select all the worksheets and then use the
Format Cells dialog box to apply a custom format of Red####;;
Select the range F:F on the District worksheet. Select all the worksheets and then use the
Format Cells dialog box to apply a custom format that will format all nonzero numbers similar
to the format applied in Step but with green for nonzero entries.
Use the Cell Styles button Home tab I Styles group to create a new cell style named My Title.
Use the Format button Styles dialog box to create a format. Use the Font sheet Format Cells
dialog box to select the Britannic Bold font, a font size of and a white font color. Check
only the Alignment and Font check boxes in the Style dialog box.
Select cells A:A on the District worksheet. Select all the worksheets. Apply the My Title style
to the cell.
Step by Step Solution
There are 3 Steps involved in it
1 Expert Approved Answer
Step: 1 Unlock

Question Has Been Solved by an Expert!
Get step-by-step solutions from verified subject matter experts
Step: 2 Unlock
Step: 3 Unlock